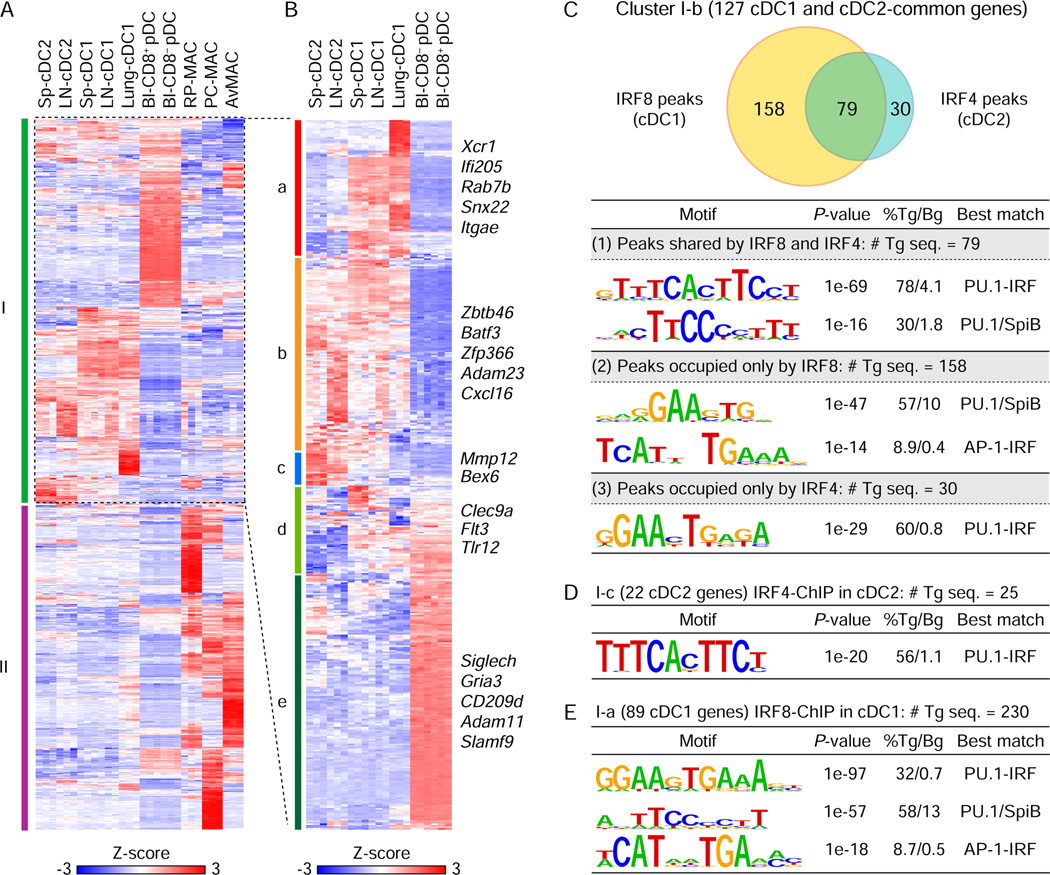
Figure 4. DNA motifs bound by IRF4 and IRF8 within cDC-specific genes.
(A) Heatmap for 853 selected genes showing specific expression in DCs (cDC and pDC) or macrophages in the indicated tissues. Sp: spleen, LN: lymph node, Bl: blood, RP-MAC: red pulp macrophages, PC-MAC: peritoneal cavity macrophages, and AvMAC: alveolar macrophages. (B) Hierarchical clustering of 462 DC-specific genes in the cluster I of (A). Gene expression was shown after normalization by Z-score. (C-E) De novo DNA motif analysis using IRF8 ChIP-seq peaks in cDC1 and IRF4 ChIP-seq peaks in cDC2 merged with the cDC-specific genes (gene body ± 50 kb). (C) A Venn diagram showing numbers of shared or specific peaks for IRF8 and/or IRF4 associated with 127 common genes for cDC1 and cDC2 in cluster I-b (top). De novo motif analysis using (1) 79 shared peaks by IRF8 and IRF4, (2) 158 specific peaks for IRF8, or (3) 30 specific peaks for IRF4 (bottom). (D) De novo DNA motif analysis using IRF4 peaks associated with 22 cDC2 genes (cluster I-c). (E) De novo DNA motif analysis using IRF8 peaks associated with 89 cDC1-specific genes (cluster I-a). # Tg seq. and % Tg/Bg denote the number of total target sequences and percentage of target sequences/percentage of background sequences, respectively.

