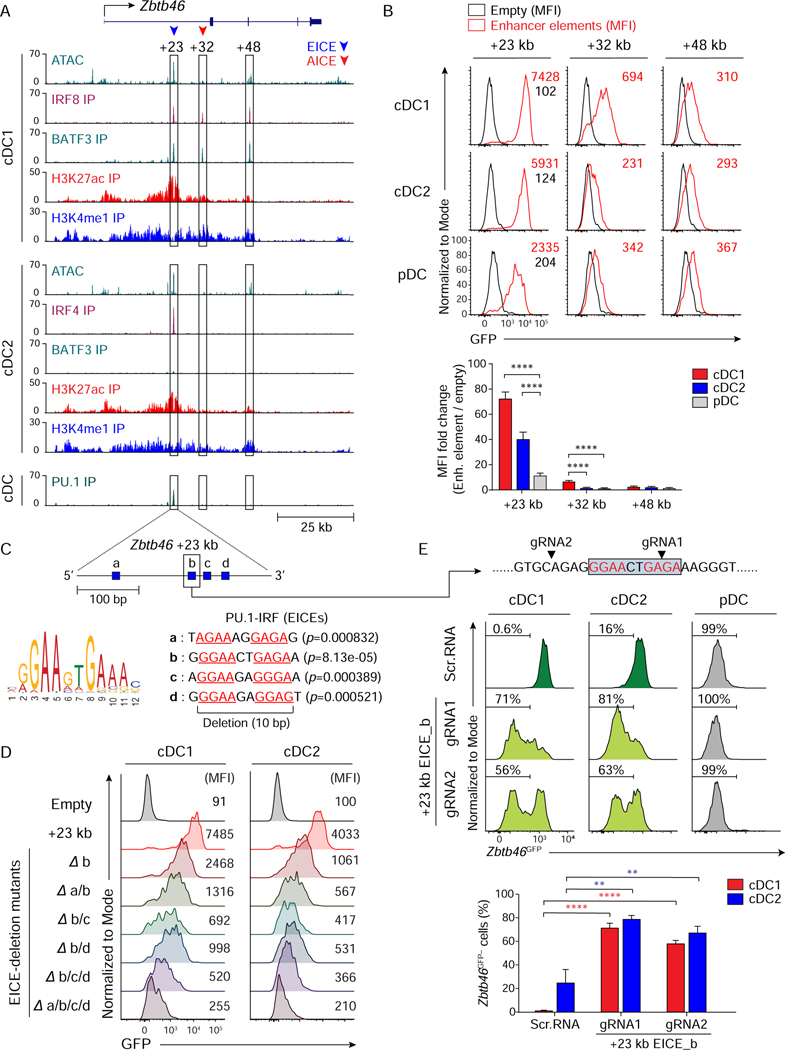
Figure 6. Zbtb46 expression relies on an EICE-dependent enhancer redundantly controlled by IRF4 or IRF8.
(A) ATAC-seq and ChIP-seq tracks display open chromatin areas and bindings of IRF8, BATF3, IRF4, H3K27ac, H3K4me1, or PU.1 around Zbtb46 locus. Boxed areas at +23 kb, +32 kb, or +48 kb from Zbtb46 TSS indicate regions assessed for enhancer activity. (B) Flow cytometric analysis showing GFP-reporter activities in cDC1, cDC2, and pDCs transduced with empty retrovirus (black) or retroviruses expressing each enhancer element (red). A bar graph below shows averages of MFI fold changes (MFI of enhancer element/MFI of empty) ± SD (n = 4). (C) FIMO analysis depicting p-values of the four predicted EICEs (blue boxes a, b, c, and d) in mouse Zbtb46 chr2: 181,436,313–181,436,629 (+23 kb from Zbtb46 TSS). (D) Flow cytometric analysis showing GFP-reporter activities in cDC1 and cDC2 expressing Zbtb46 +23 kb enhancer or mutants with internal deletion of the indicated EICE(s). Data shown is one of three similar experiments. (E) Flow cytometric analysis showing Zbtb46GFP expression in cDC1, cDC2, or pDC differentiated from Zbtb46GFP/+ Rosa26Cas9-GFP/+ CD117hi BM progenitors expressing scramble RNA or sgRNA(s) targeting Zbtb46 +23 kb EICE_b as depicted above the single-color histograms and in 6C. Targeting sites for EICE_b by sgRNAs are indicated with black arrowheads. Numbers in the histograms indicate the percentage of Zbtb46GFP-negative (Zbtb46GFP−) cells. The average percentages of Zbtb46GFP− cells ± SD (n = 3) are shown as a bar graph below. ** P < 0.01, **** P < 0.0001 (Student’s t-test). See also Figures S6 and S7.

