Figure 1.
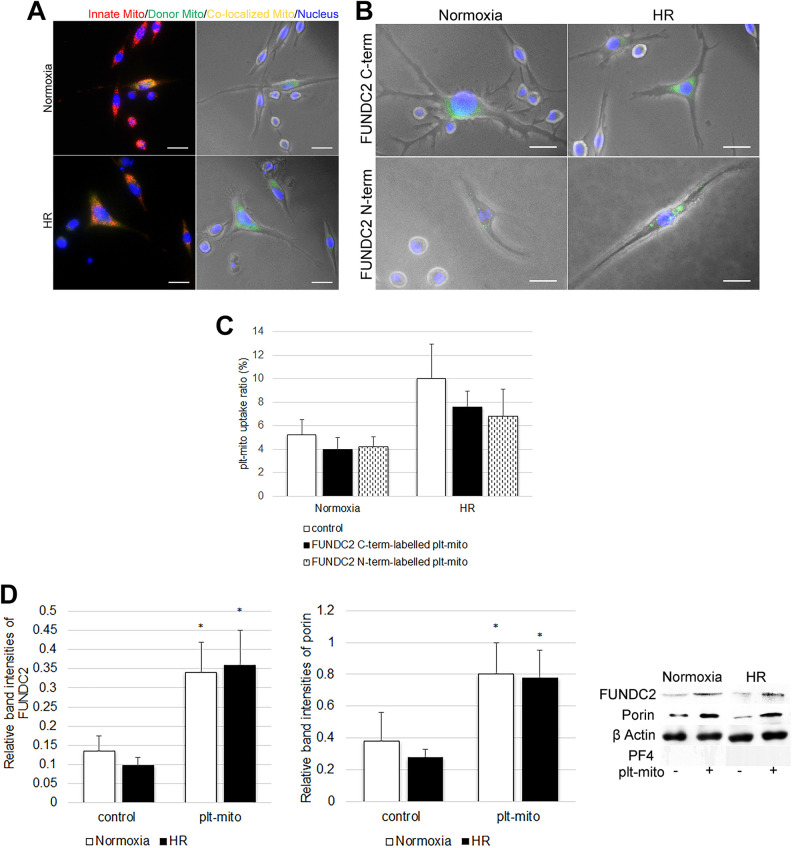
Internalization of plt-mito and FUNDC2-labelled plt-mito by SH-SY5Y cells. (A) Internalization of plt-mito by SH-SY5Y cells under normoxic and HR conditions was observed by fluorescent microscopy. Scale: 200 nm. Red (Mitotracker Red), green (Mitotracker Green) and yellow fluorescence represent plt-mito, innate mitochondria and co-localized mitochondria, respectively. Nuclei were dyed with DAPI (blue fluorescence). (B) Uptake of FUNDC2-labelled plt-mito by the cells under normoxic or HR condition was observed by fluorescent microscopy. Scale: 200 nm. Green (Alexa Fluor Plus-488) fluorescence represents plt-mito labelled with anti-FUNDC2 N- or C-term antibodies. (C) Quantification of plt-mito uptake ratio, n = 5. (D) Following plt-mito transplantation, FUNDC, porin, and PF4 levels were evaluated in the recipient cells under normoxic and HR conditions, n = 5. *P < .05 vs. control.

