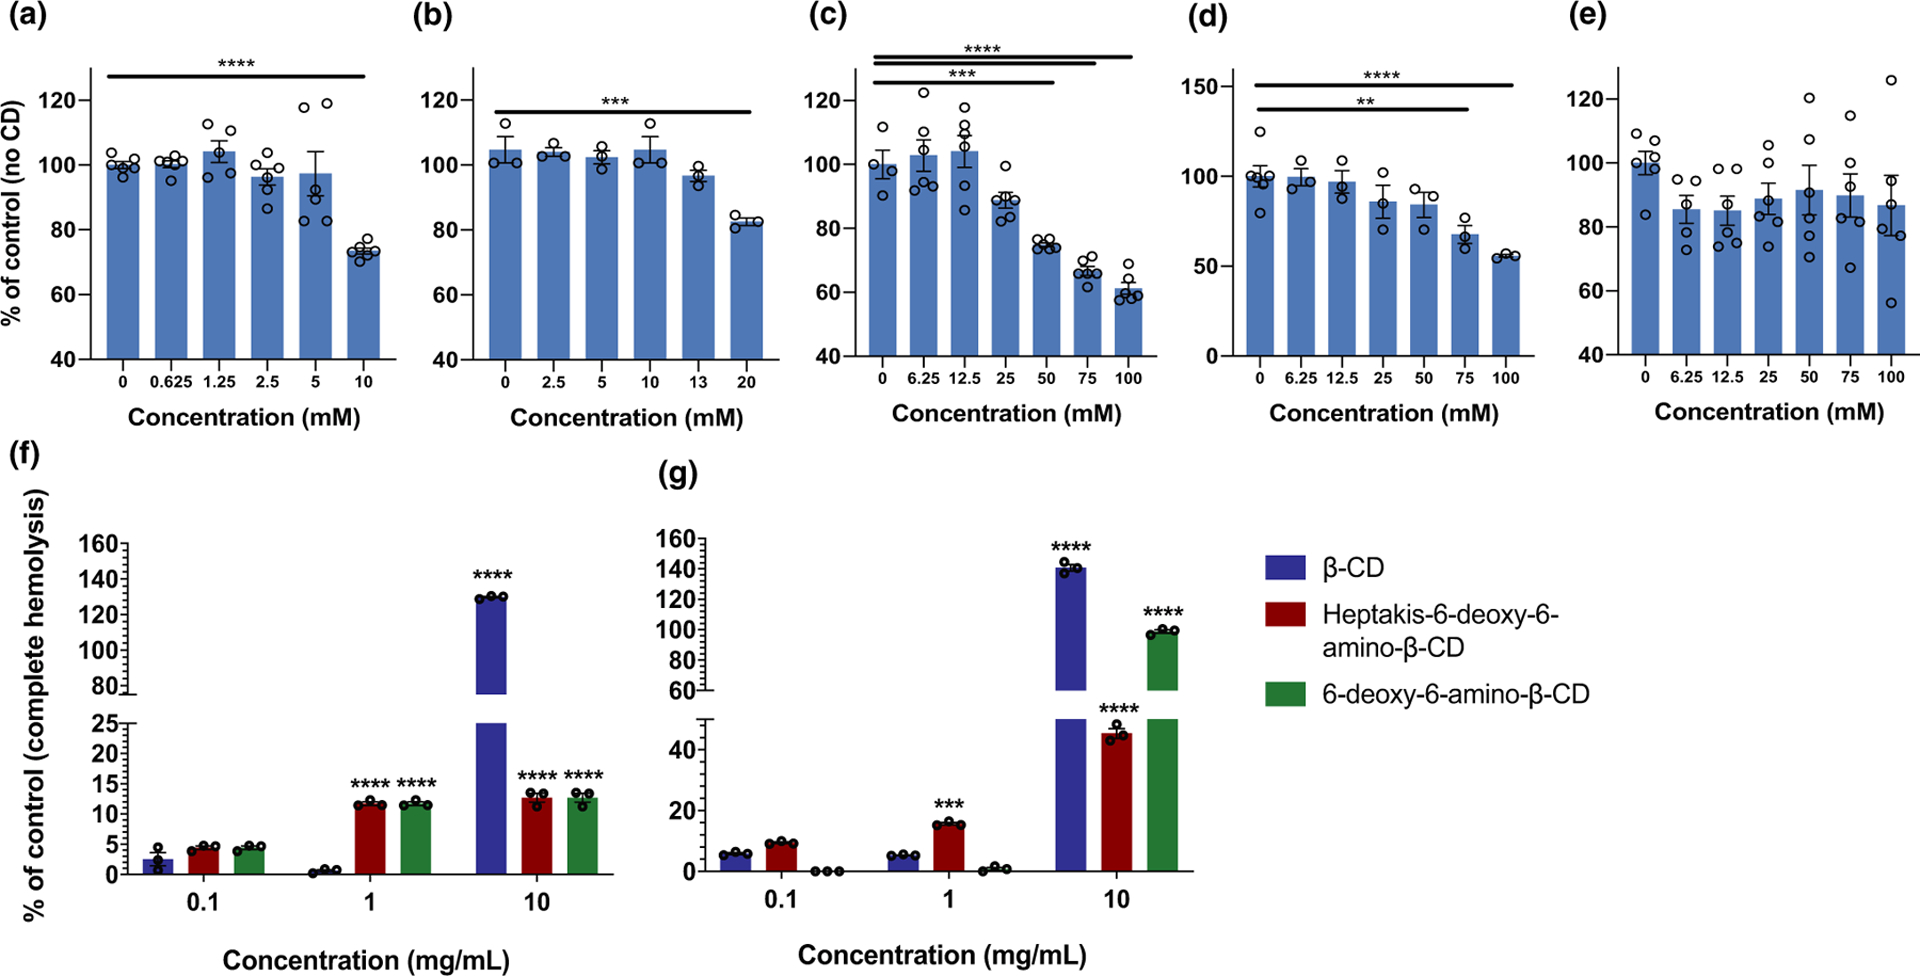
Figure 2.

Comparison of induced cytotoxicity on human brain endothelial cells by five cyclodextrins as follows: (a) beta-cyclodextrin (β-CD); (b) heptakis-6-(3-O-propyl-1-sulfonic acid)-β-CD sodium salt; (c) 6-deoxy-6-amino-β-CD; (d) 2-hydroxypropyl-β-CD; and (e) heptakis-6-deoxy-6-amino-β-CD. Data (unpublished) are expressed as a percentage relative to the negative control (no CD), (f) and (g) hemolytic activity on β-CD, heptakis-6-deoxy-6-amino-β-CD and 6-deoxy-6-amino-β-CD. Data are expressed as a percentage relative to the positive control (complete hemolysis). For all experiments, data are presented as the mean ± the standard error of the mean (SEM). Individual replicates are shown and indicated by circular data points on each bar. A two-way analysis of variance (ANOVA) with a Tukey’s post hoc test was used to determine statistical significance. Significance relative to the 0.1 mg/mL concentration is shown: ***P < 0.001, ****P < 0.0001.
