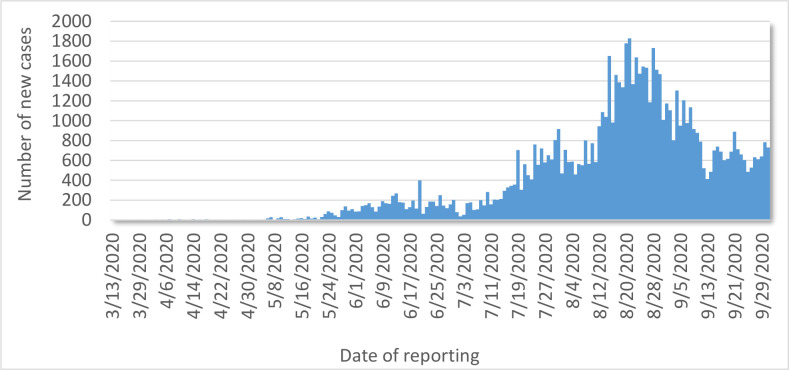
Figure 2.
Epidemiological trend of confirmed COVID-19 cases in Ethiopia as of 29 September 2020. A bar chart showing the number of new confirmed COVID-19 cases per day starting from 13 March 2020 when the first case of COVID-19 was confirmed in Ethiopia. Data on the number of new cases were collected daily through the laboratory and surveillance pillars, compiled and used to develop the epidemiological trend. The epidemiological curve shows a slow and gradual increase in the COVID-19 confirmed cases in the first 4 months since March 2020. The readiness and early response measures may have contributed to this trend.

