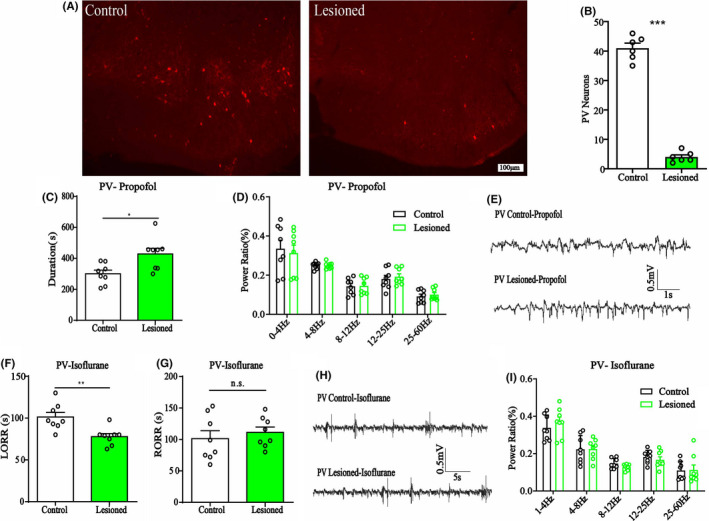
FIGURE 2.

A, Immunoflurescence of BF GABAParv neurons in control (left) and lesioned mice (right), scale bar: 100 μm. B, Mean numbers of BF GABAParv neurons of control and lesioned mice (41.00 ± 1.67 to 4.00 ± 0.73). C, The duration time of propofol anesthesia in BF GABAParv neuron lesioned group, which is longer than that in control mice, n = 8, *p < 0.05, unpaired t‐test. D, The power spectrum analysis of EEG recording in propofol anesthesia of BF GABAParv neuron lesioned group, n = 8, n.s., no significant, two‐way ANOVA. E, Representative EEG traces under propofol anesthesia in BF GABAParv neuron lesioned and control mice. F, G, The LORR (F) and RORR (G) time of isoflurane anesthesia in BF GABAParv neuron lesioned group, n = 8, **p < 0.01, n.s., no significant, unpaired t‐test. H, Representative EEG traces under isoflurane anesthesia in BF GABAParv neuron lesioned and control mice. I, The power spectrum analysis of EEG recording under 30 min isoflurane anesthesia in GABAParv neurons lesioned group, no difference, n = 8, two‐way ANOVA. All graphs show mean ± SEM
