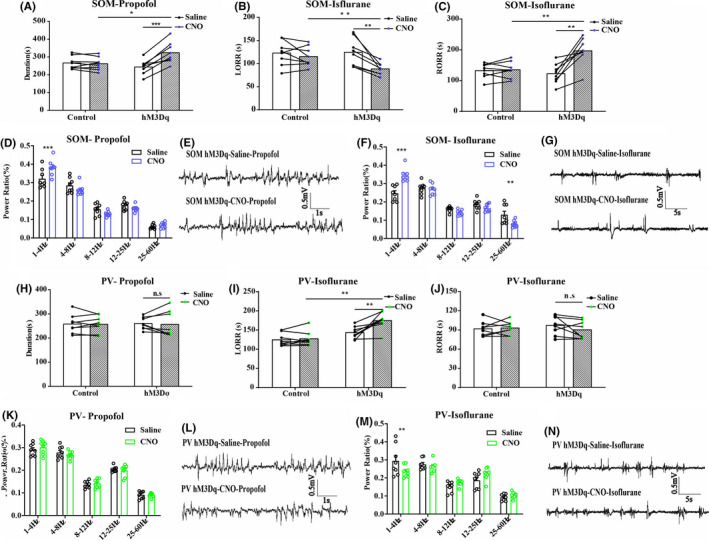
FIGURE 4.

A, The duration time of propofol anesthesia in BF GABASOM neuron with hM3Dq group, n = 8, *p < 0.05, ***p < 0.001, paired t‐test. B, C, The LORR (B) and RORR (C) time of isoflurane anesthesia in BF GABASOM neuron with hM3Dq group, n = 8, **p < 0.01, paired t‐test. D, E, The power spectrum analysis (D) and representative EEG traces (E) of EEG recording of mice with activated BF GABASOM neurons in propofol anesthesia, n = 8, ***p < 0.001, two‐way ANOVA. F, G The power spectrum analysis (F) and representative EEG traces (G) of EEG recording of mice with activated BF GABASOM neurons in isoflurane anesthesia, n = 8, **p < 0.01, ***p < 0.001, two‐way ANOVA. H, The duration time of propofol anesthesia in BF GABAParv neuron with hM3Dq group, n = 8, n.s., no significant, paired t‐test. I, J, The LORR (I) and RORR (J) time of isoflurane in BF GABAParv neuron with hM3Dq group, n = 8, **p < 0.01, n.s., no significant, paired t‐test. K–N, The power spectrum analysis of EEG recording of mice with activated BF GABASOM neurons in propofol (K, L) and isoflurane (M, N) anesthesia, n = 8, two‐way ANOVA
