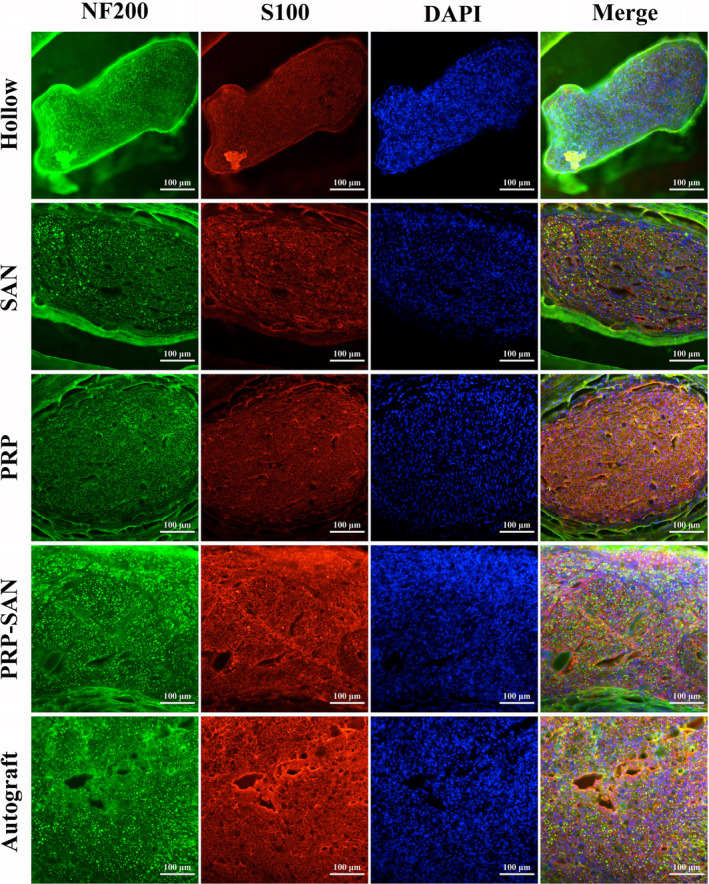
FIGURE 6.

Representative photograph of immunofluorescence staining of the midpoint of a nerve graft from each group at 12 weeks after surgery. Green fluorescence (NF200) shows axons, red fluorescence (S100) shows Schwann cells (SCs), and blue fluorescence (DAPI) shows the nucleus. Scale bar =100 μm
