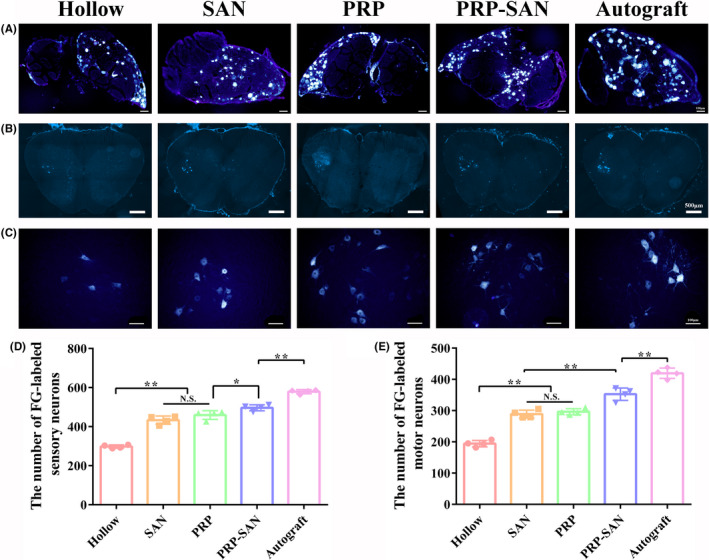
FIGURE 9.

Fluor‐Gold (FG) retrograde tracing of neurons at 12 weeks after surgery. (A) Representative photograph of FG‐labeled sensory neurons in each group. Scale bar =100 μm. (B) Representative photograph of FG‐labeled motor neurons in each group. Scale bar =500 μm. (C) Enlargement of the photograph shown in (B). Scale bar =100 μm. (D) The number of FG‐labeled sensory neurons in each group. (E) The number of FG‐labeled motor neurons in each group. Data are presented as the mean ±SD. * p <.05; ** p <.01; N.S., no significant
