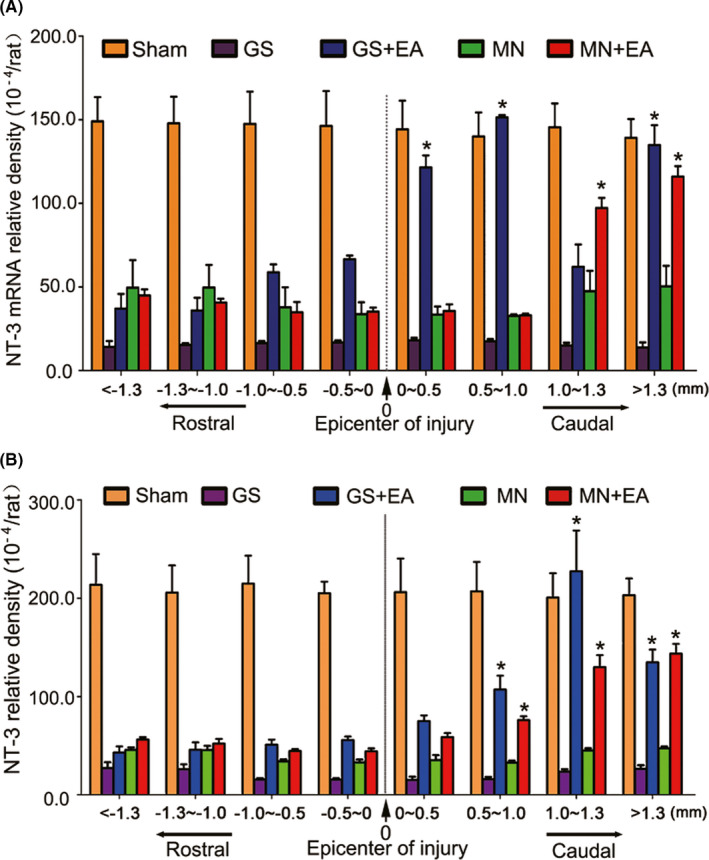
FIGURE 6.

The density of neurotrophin‐3 (NT‐3) mRNA and protein in the injured spinal cord. (A) Bar charts displaying the relative densities of NT‐3 mRNA in eight regions in the rostral and caudal areas relative to the injury site of the spinal cord for five groups. The density of NT‐3 mRNA was significantly increased in the caudal site compared with the rostral area in the GS+EA and MN+EA groups. Values represent the mean ±SD (n = 5/group, *p < 0.05). (B) Bar charts showing the relative densities of NT‐3 protein expression in eight regions in the rostral and caudal areas relative to the injury site of the spinal cord for five groups. The density of NT‐3 protein was significantly increased in the caudal area compared with the rostral area in the GS+EA and MN+EA groups. Values represent the mean ±SD (n = 5/group, *p < 0.05). GS: gelatin sponge scaffold with no cells; GS+EA: GS combined electroacupuncture; MN: MSC‐derived neural network; MN+EA: MN combined with electroacupuncture
