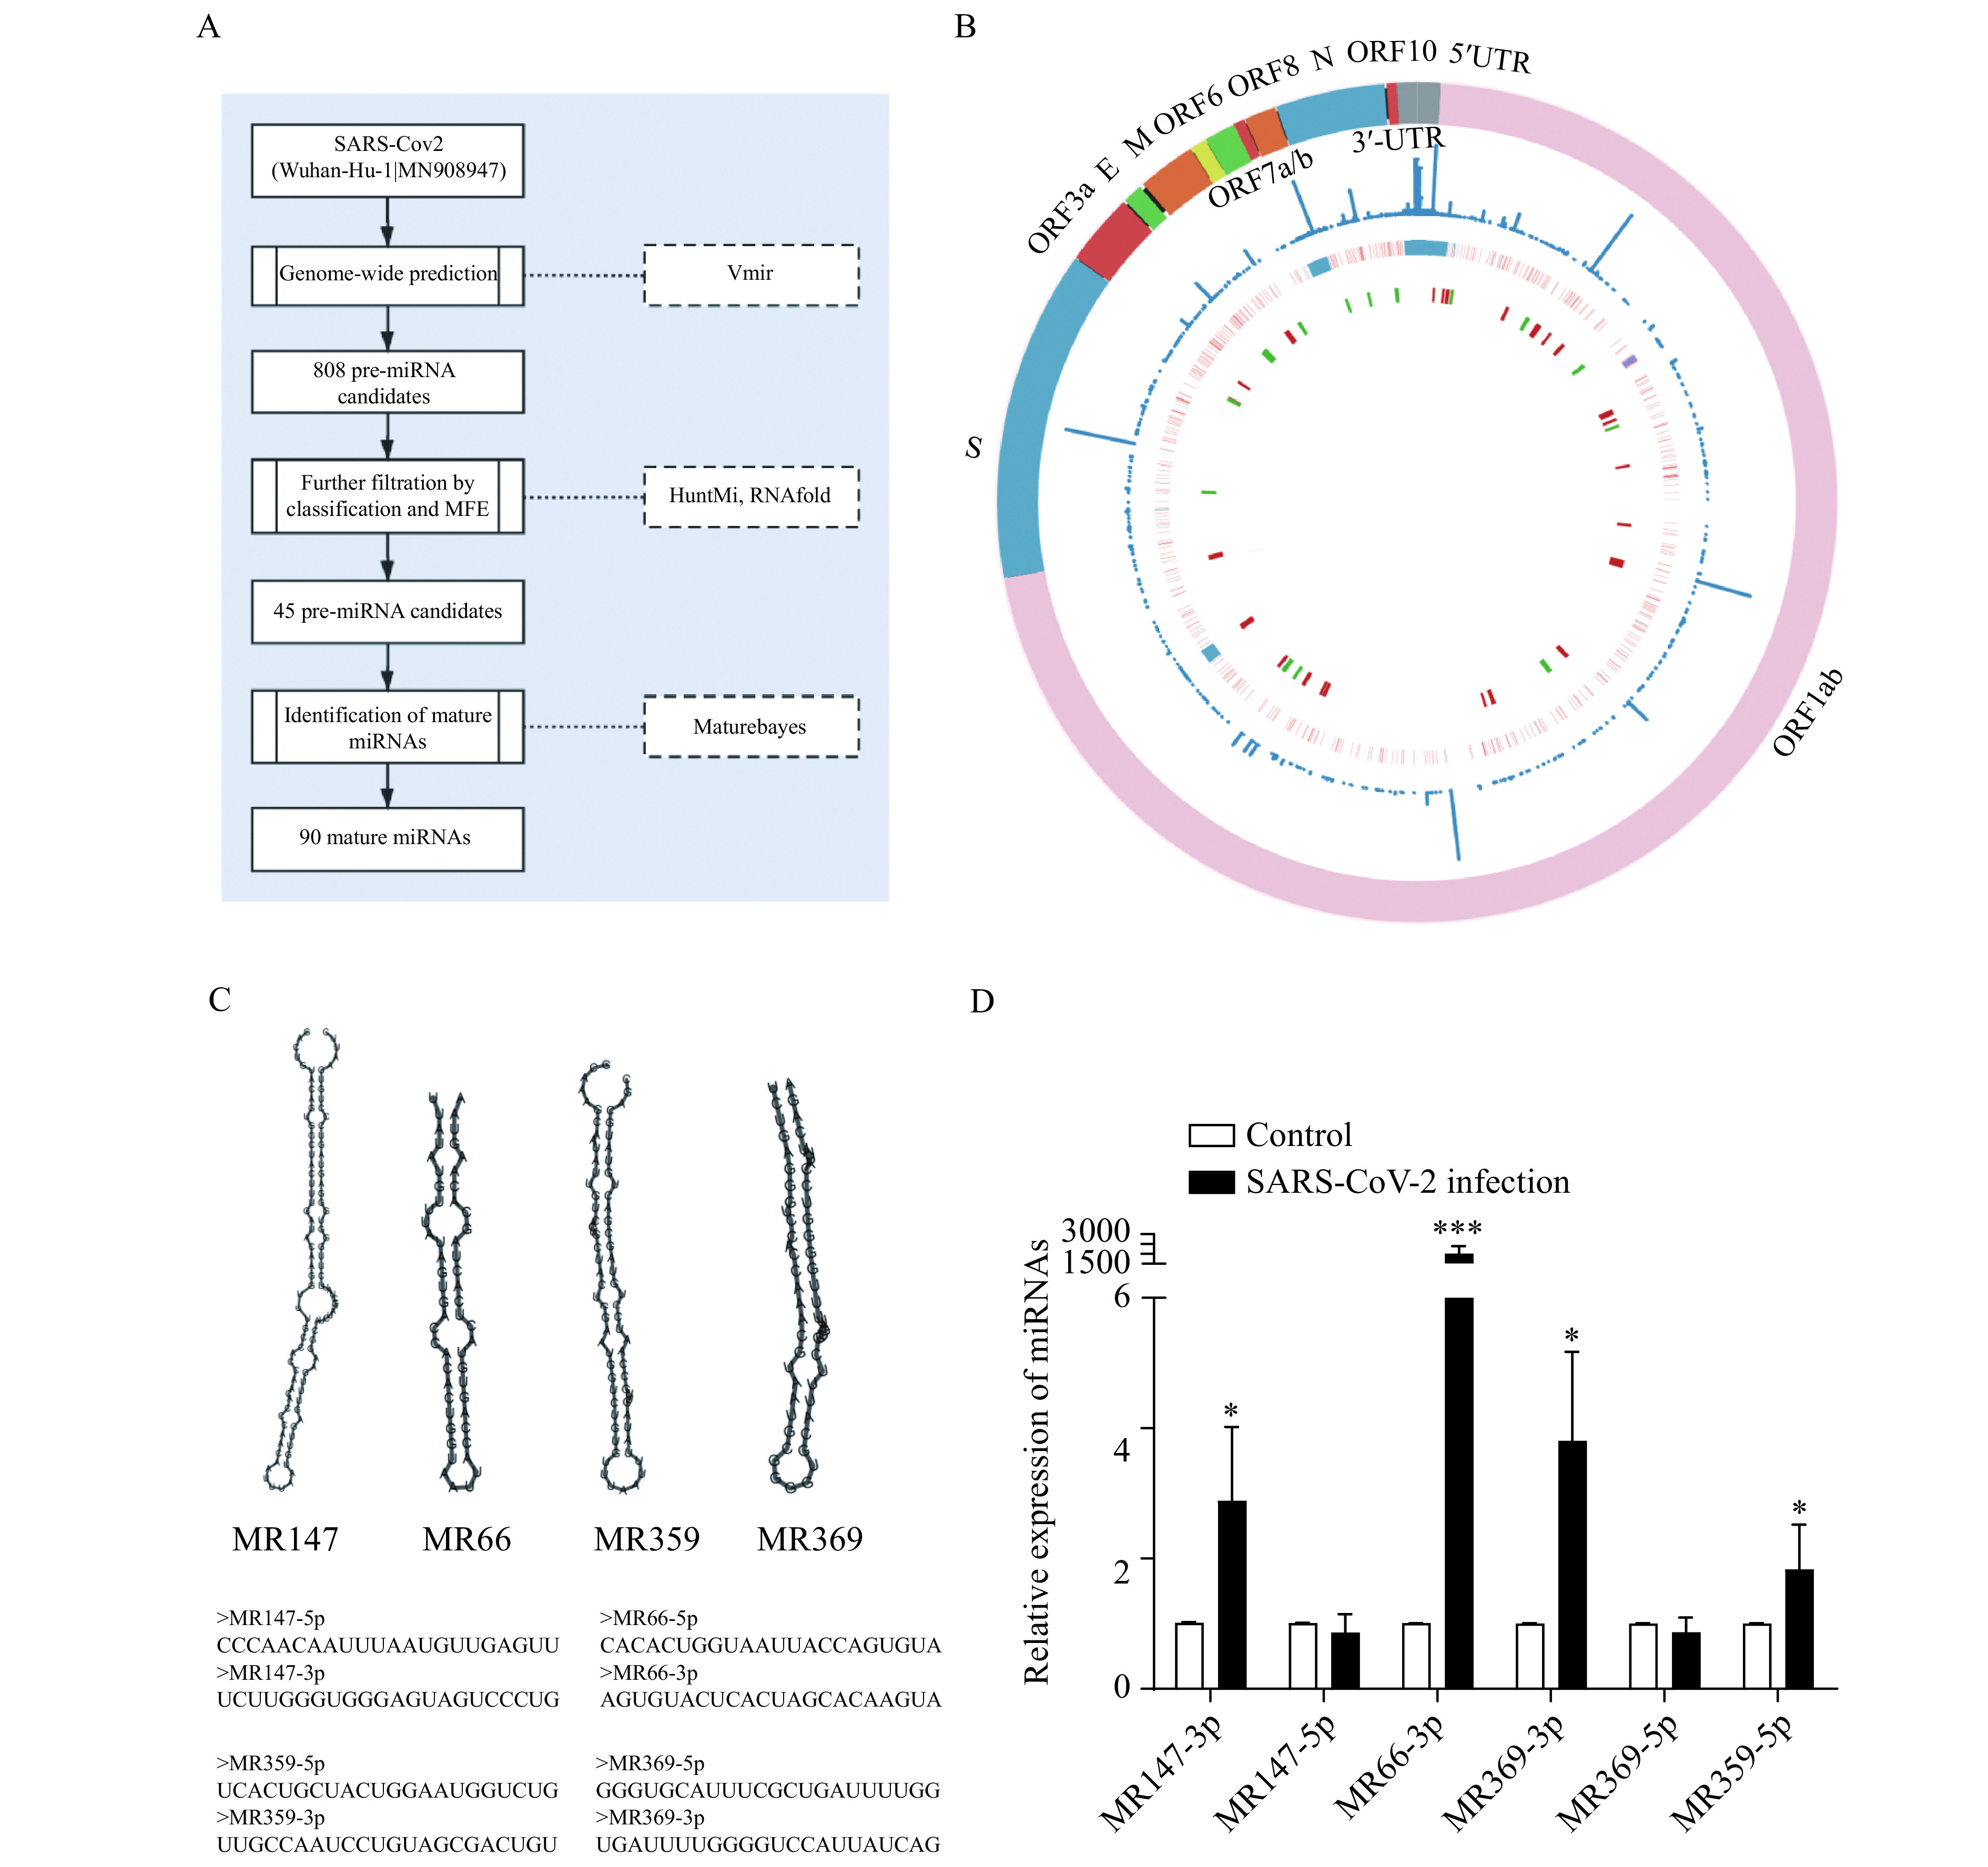
Figure 1.

Overview of the putative SARS-CoV-2 encoded miRNAs.
A: The schematic workflow for virus miRNA identification. B: The innermost cycle demonstrated the distribution of the candidate pre-miRNAs across the SARS-CoV-2 genome with red and green representing pre-miRNAs in the direct direction and reserve direction, respectively. The middle layer showed the mutation in the genome with red denoting SNPs, and blue denoting deletions. Outside of it is the frequency of the variations. C: The hairpin structure of the example pre-miRNAs putatively encoded by SARS-CoV-2. D: RT-qPCR analysis of the candidate SARS-CoV-2-encoded miRNAs expression levels in Vero E6 cells infected with SARS-CoV-2 (n=3, data are presented as mean±SD). Two-sided Student's t-test, *P<0.05,***P<0.001. MFE: minimum free energy.
