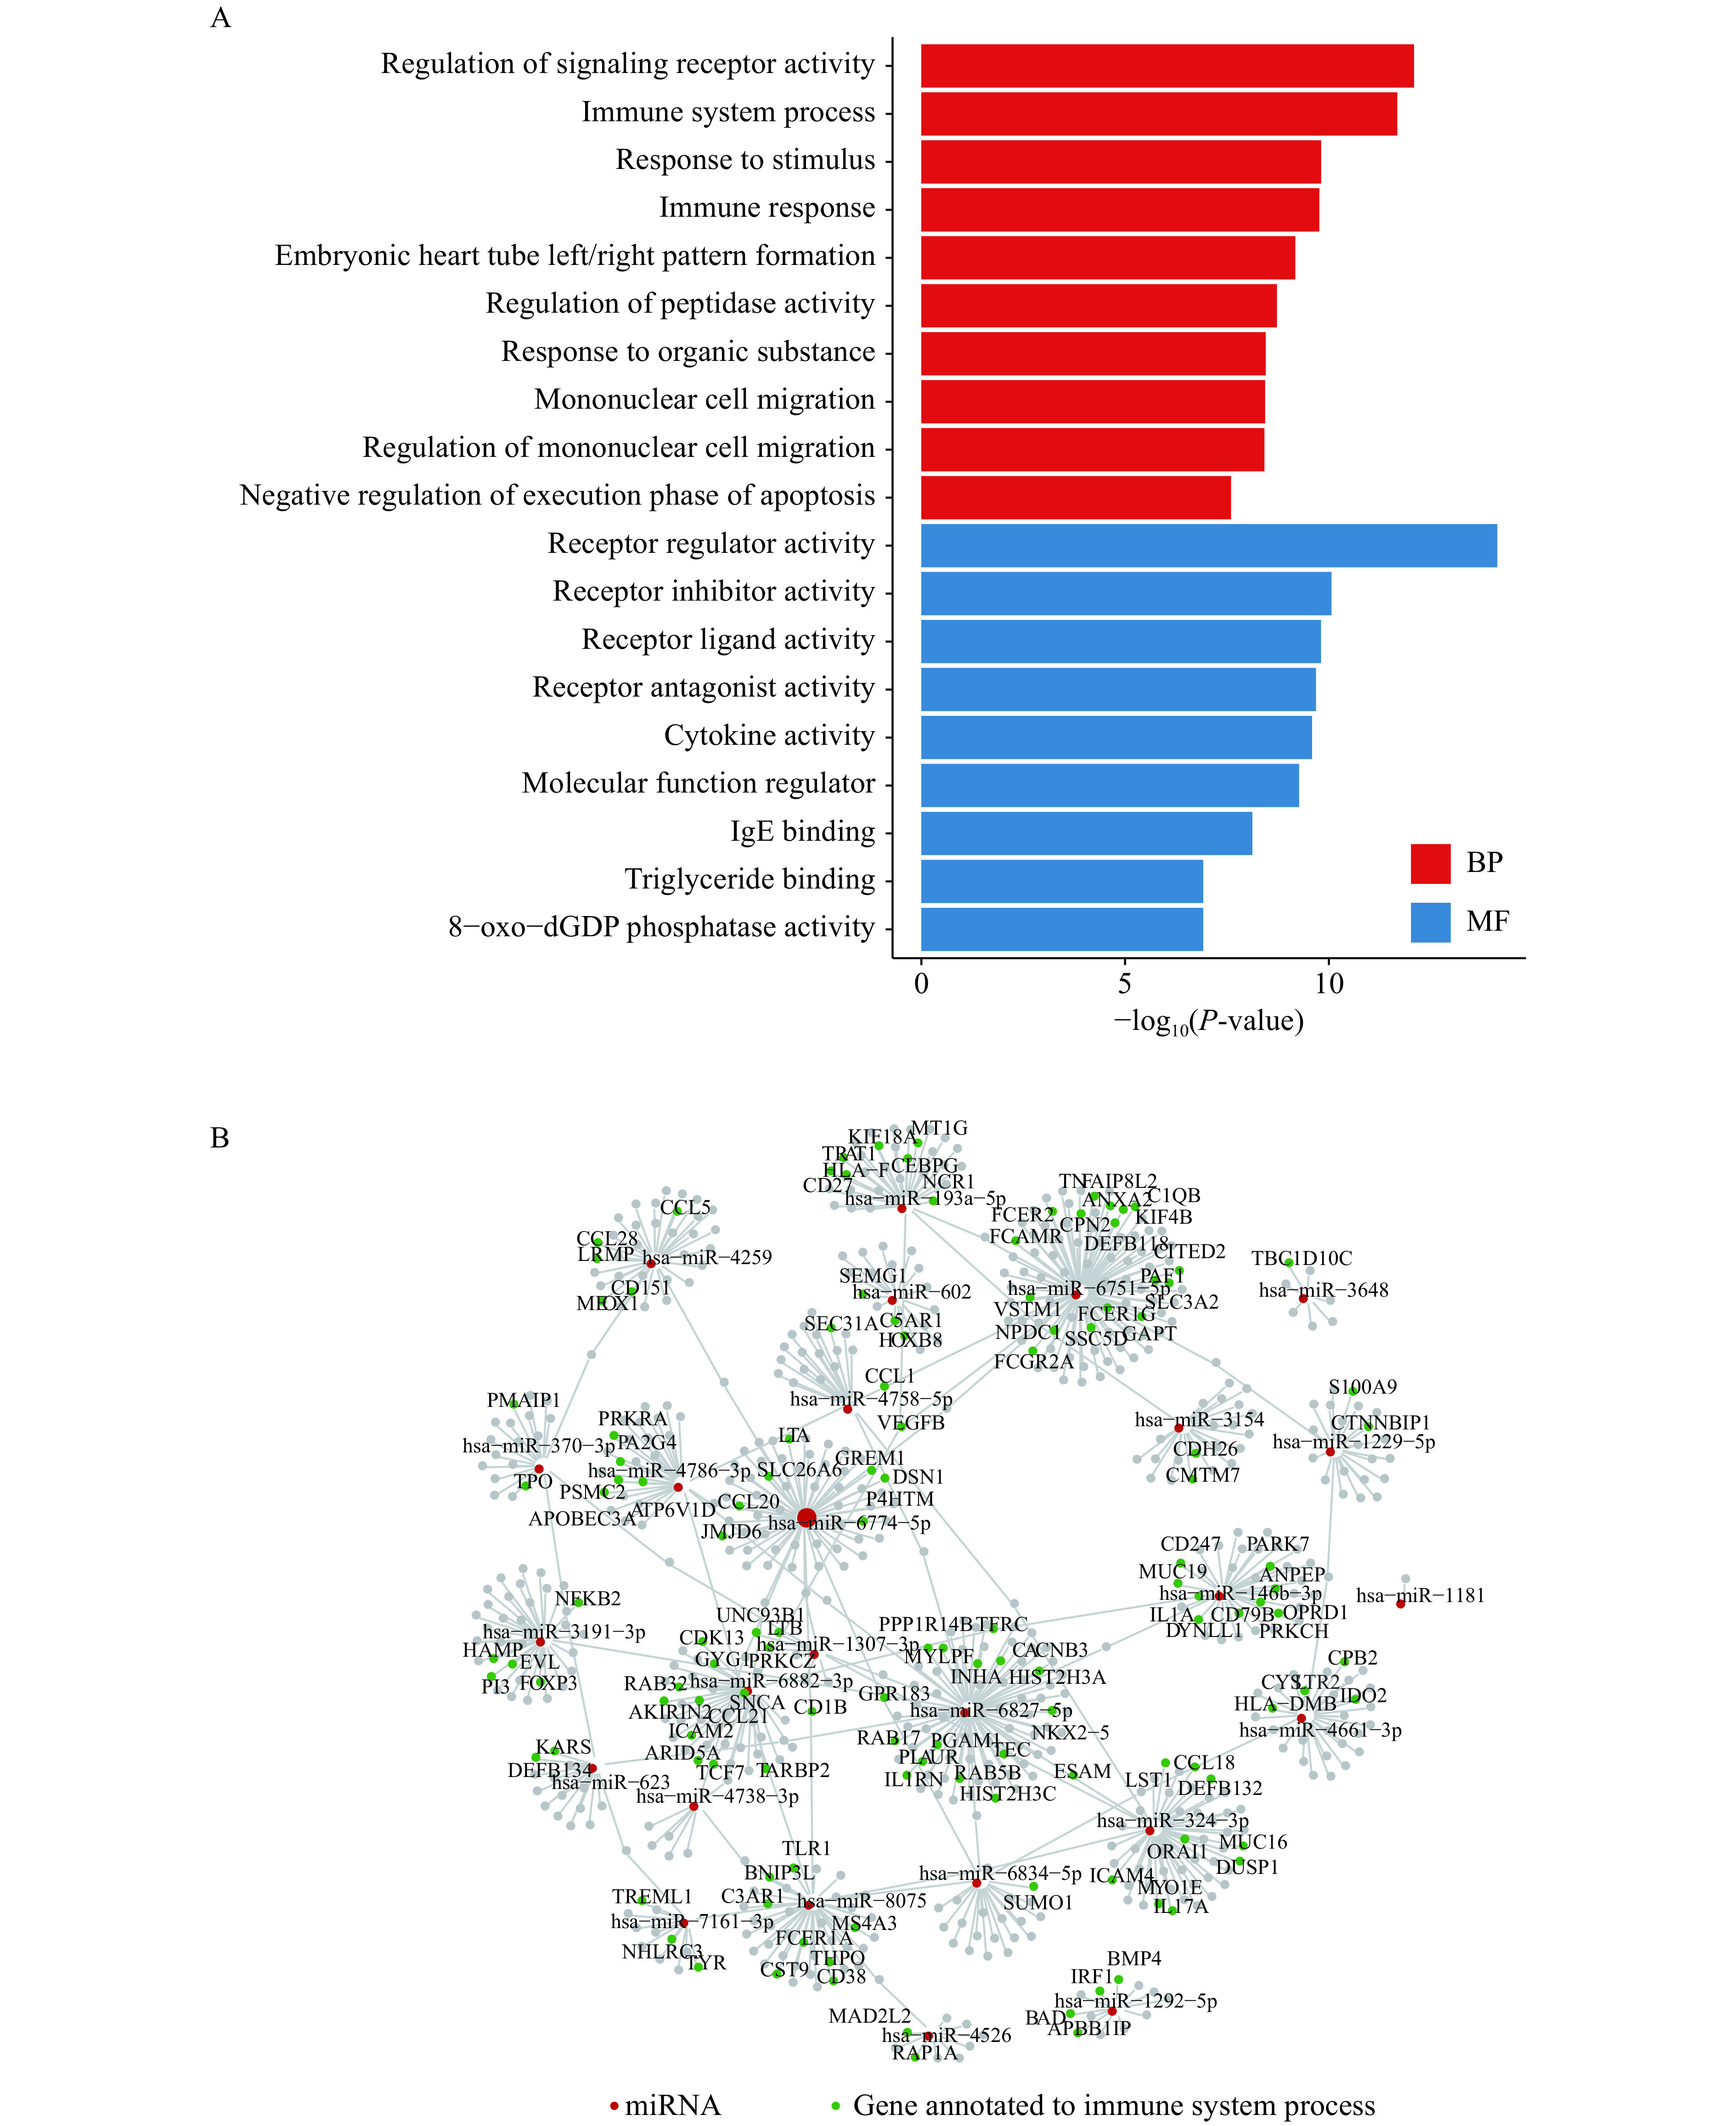
Figure 3.

Genes targeted by the virus-genome-hijacked miRNAs.
A: The barplot for the enriched functions of genes regulated by the host miRNAs attracted by the virus miRNAs. B: The network of the regulation between the hijacked human miRNAs and genes. The red nodes represent the miRNAs. The greens are genes annotated to the immune system processes, and greys are annotated to other functions. BP: biological process; MF: molecular function.
