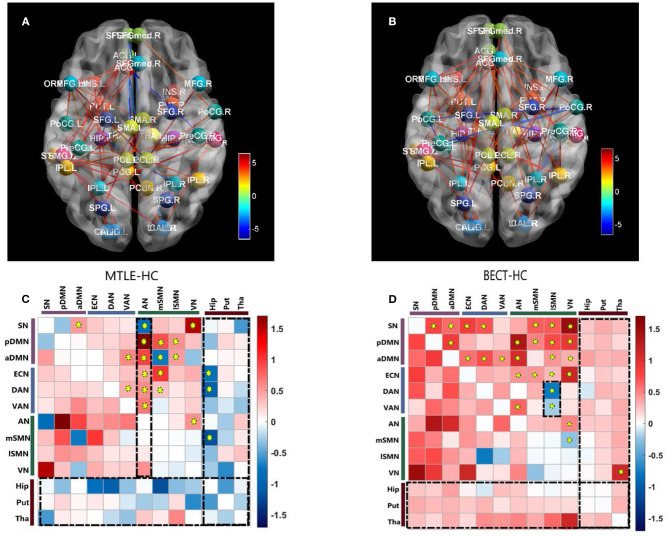
Figure 2.
Pairwise comparisons of Internetwork connectivity aberration. Values represented t-statistics between 10 networks and 3 subcortical regions of interest (ROIs: bilateral hippocampus, putamen and thalamus) in the pairwise comparisons of MTLE- HC (A, C) and BECT- HC (B, D). Tests of statistical significance were based on two-sample t-test corrected for multiple comparisons with a network-based statistic (NBS) threshold set to 0.05. Thredsholded edges and nodes corresponded results of internetwork connectivity (A, B). Specially, we used AAL coordinates to symbolically depict the subcortical ROIs. To better elucidate the general trend, matrix maps were used (C, D). Significant differences are also marked by yellow circuses in the connectivity matrices. The black rectangular box highlighted the characteristic networks, AN in MTLE-HC and lSMN in BECT-HC (details as shown in Figure 3).

