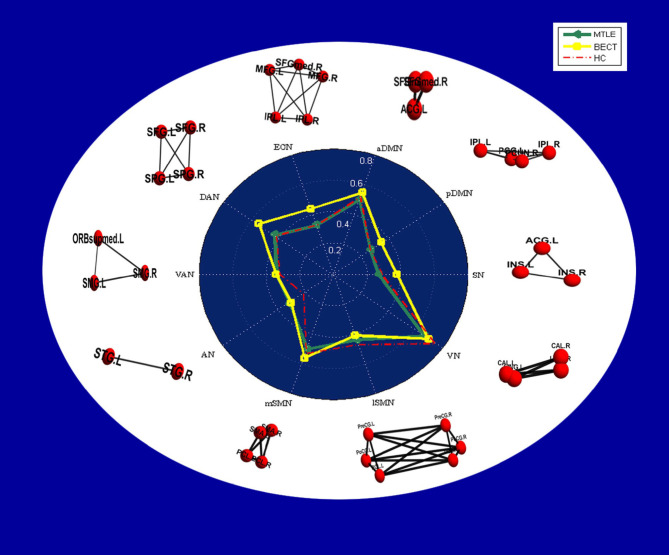
Figure 4.
Radar plots showing intranetwork RSFC differences in each group. The values displayed by the dots in the radar plots are the Fisher z-transformed values of Pearson's correlation in each group, and a table of the values is provided in Supplementary Table 1. In the white area, node-edge graphs of 10 RSNs were showed according to Table 2.

