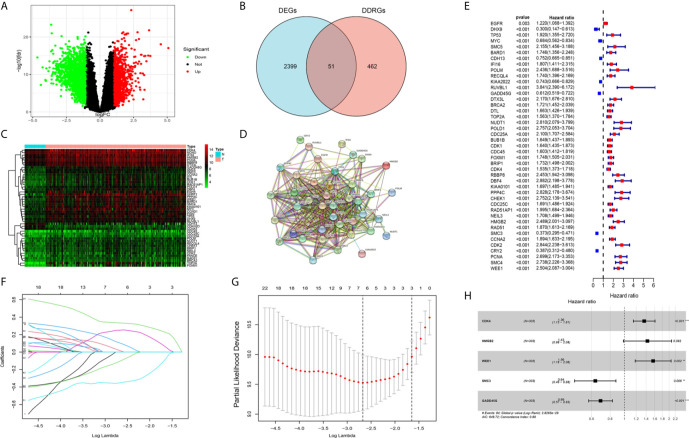
Figure 2.
Screening candidate genes and construction a DNA damage repair genes (DDRGs) signature using LASSO regression and Cox proportional hazards regression. (A) Volcano plot of differentially expressed genes (DEGs) between gliomas and normal brain tissues. (B) Venn diagram showing the intersection of DEGs and DDRGs. (C) Heatmap was used to show the expression of the genes at the intersection. (D) The protein–protein interaction (PPI) network downloaded from the STRING database indicated the interactions among the candidate genes. (E) Forest plot showing the hazard ratios from the univariate Cox regression analysis. (F) LASSO coefficient profiles of the 43 candidate genes in TCGA training dataset. (G) A coefficient profile plot was generated against the log (lambda) sequence. Selection of the optimal parameter (lambda) in the LASSO model for TCGA training dataset. (H) Forest plot showing the five genes that composed the DDRGs signature. LASSO, least absolute shrinkage and selection operator; STRING, Search Tool for the Retrieval of Interacting Genes; TCGA, The Cancer Genome Atlas. **p < 0.01,***p < 0.001.

