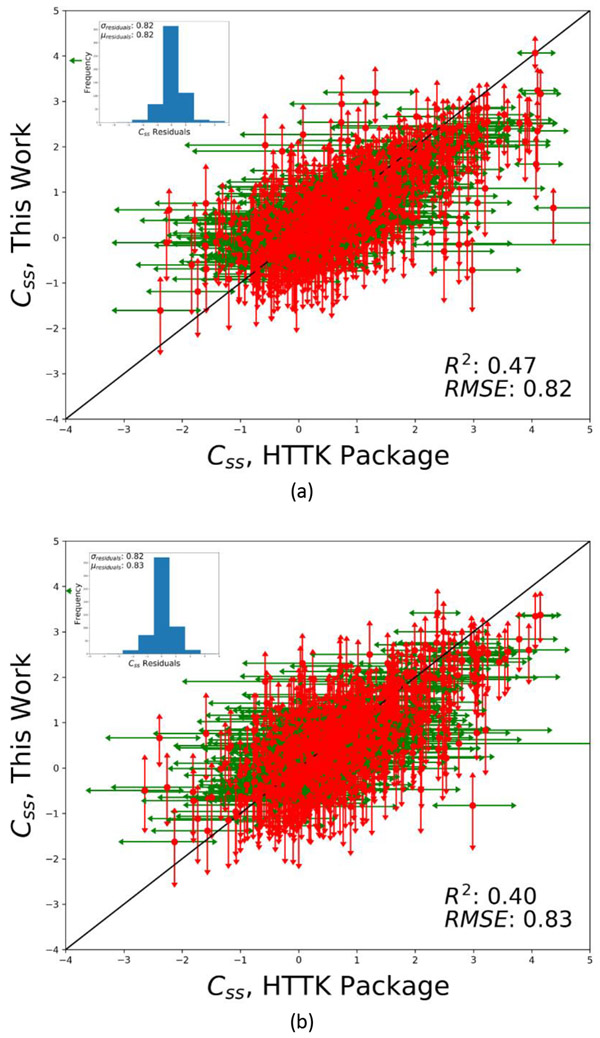
Figure 4.
Comparison of Css calculated using the models in this work (in silico Css) calculations with Css calculated using the data in HTTK package (in vitro Css) for (a) the ER-AR dataset and (b) the entire set of chemicals with in vitro fub and clint data from the HTTK package. The plots incorporate the variability in Css calculations owing to the underlying experimental variability in the fub and Clint data. The standard deviation of residuals from this analysis were used in the BER analysis (for the ER-AR dataset) to derive a conservative estimate of dose for hazard assessment. The Css units are log10 mg/kg. Note that the analysis excludes all chemicals that were in the training dataset for development of the fub and clint models.

