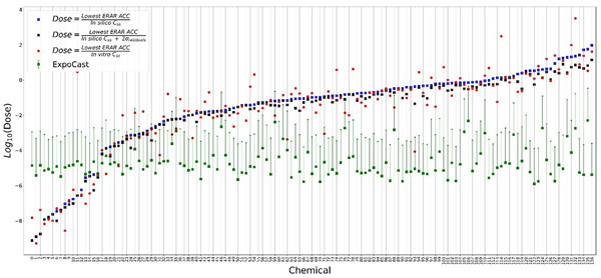
Figure 5.
Bioactivity-exposure ratio (BER) plot to compare human oral equivalent doses (OEDs) and exposure predictions. Lowest and a conservative estimate of ToxCast derived OEDs (visualized as blue and black squares, respectively) were compared with the exposure estimates (visualized as median exposure value along with a 95% upper confidence interval in green). The plot is ordered by lowest ToxCast OED estimate. This analysis allows for the generation of a BER plot that compares hazard to exposure estimates within a high-throughput risk assessment framework to aid chemical screening and risk-prioritization.

