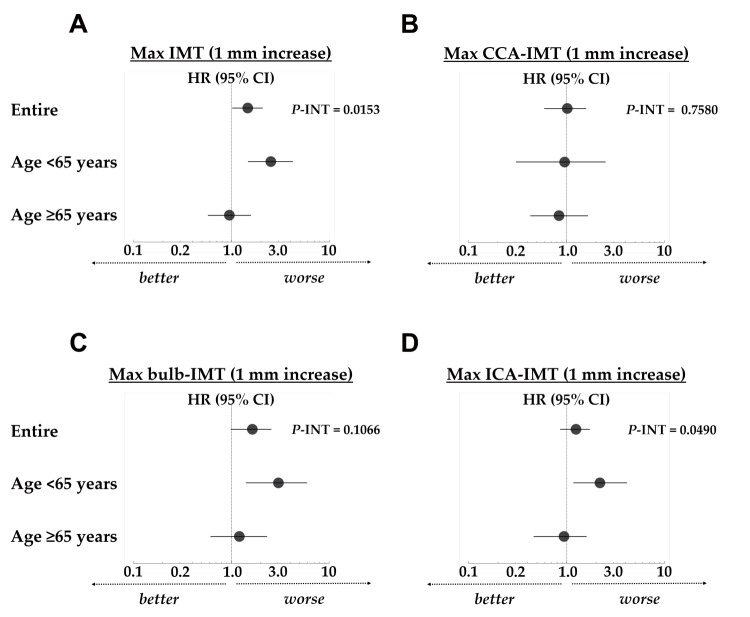
Fig. 1. Hazard ratios for renal prognosis derived from the multivariate Cox proportional hazards analyses .
(A) Max IMT; (B) Max CCA-IMT; (C) Max bulb-IMT; (D) Max ICA-IMT. The circles represent HRs and the bars represent 95% CI for the association with renal prognosis, with an eGFR decline ≥ 30% or ESRD as the endpoint (derived from Table 3). The P -value for the interaction is derived from the multivariate Cox analyses including interaction terms (all variables * age ≥ 65 years) for the entire study population in Table 2.
Abbreviations: Max IMT, maximum measurable intima-media thickness in the entire scanned common carotid arteries, carotid bulbs, and internal carotid arteries; Max CCA-IMT, maximum intima–media thickness of the common carotid artery; Max bulb-IMT, maximum intima–media thickness of the carotid bulb; Max ICA-IMT, maximum intima–media thickness of the internal carotid artery; HR, hazard ratio; CI, confidence interval; P -INT, P -value for the interaction; P , calculated probability; eGFR, estimated glomerular filtration rate; ESRD, end-stage renal disease.

