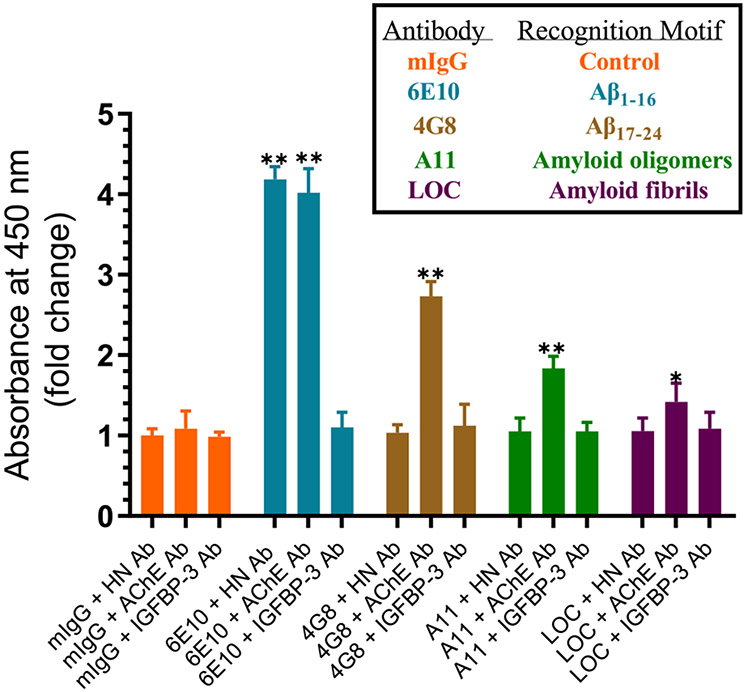
Figure 7.
HN was detected upon using Aβ 6E10 antibodies, while different levels of AChE were detected using all the amyloid antibodies. Cells (0.2 × 10⁵ cells per well) were seeded in 96-well plates in a 10% FBS-supplemented medium. The next day, the cells were incubated in a serum-free medium for 72 h. Specific antibodies were added (1:1000 dilution) to the ELISA wells. After blocking the wells, 300 μL of the A549 cell conditioned medium (0.5 μg/μL, 72 h post serum starvation) was added. The proteins and peptides were detected using their corresponding primary antibodies and then processed as described in the Experimental Procedures. Each column represents the mean ± SD of three independent and separate experiments, each of which was performed in triplicate. Data processing was carried out using the GraphPad 8.3.1 software. Asterisks (*) indicate a statistically significant difference between each treatment relative to the mIgG controls. The absence of asterisks indicates no significance (Mann–Whitney test, *p < 0.05, **p < 0.01).

