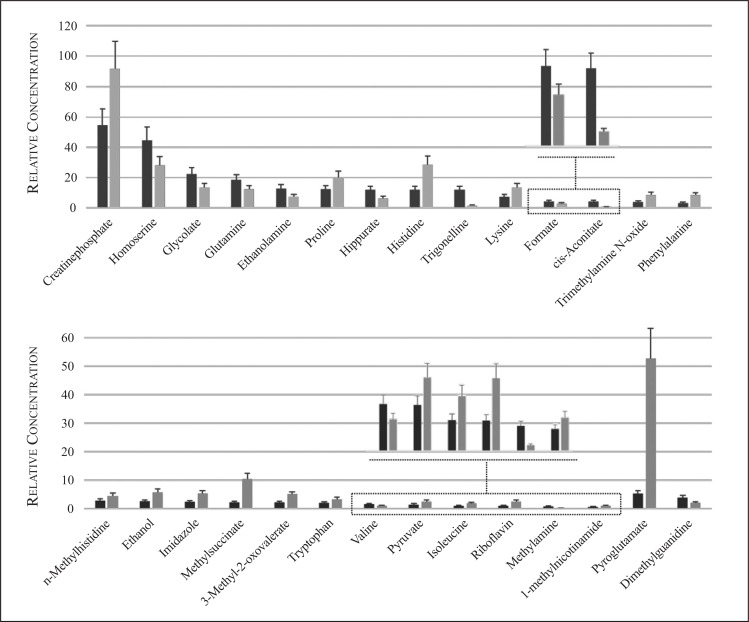
Fig. (2).
A vertical bar plot shows progressive changes of the metabolites relative concentration on urine samples before (dark grey) and after drug therapy (light grey). The error bar represents a 20% uncertainty. (A higher resolution / colour version of this figure is available in the electronic copy of the article).

