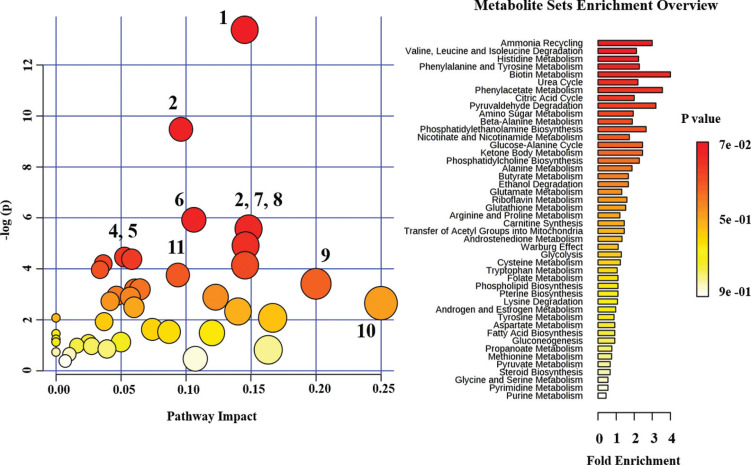
Fig. (3).
Metabolic pathway analysis carried out by using all metabolites significantly changed in the urine sample after drug therapy. Metabolic pathways are arranged according to the scores from enrichment analysis (-log (p)) and topology analysis (pathway impact). The point color is based on its p-value and the point radius is determined based on their pathway impact values. Pathway: 1) Aminoacyl-tRNA biosynthesis; 2) Nitrogen metabolism; 3) Methane metabolism; 4) Arginine and proline metabolism; 5) Glycine, serine and threonine metabolism; 6) Glyoxylate and dicarboxylate metabolism; 7) Valine, leucine and isoleucine biosynthesis; 8) Phenylalanine metabolism; 9) Alanine, aspartate and glutamate metabolism; 10) Synthesis and degradation of ketone bodies, 11) Citrate cycle (TCA cycle). (A higher resolution / colour version of this figure is available in the electronic copy of the article).

