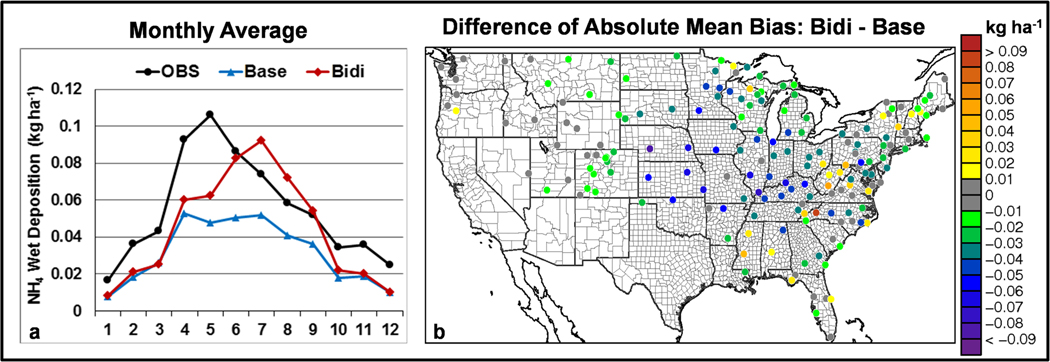
Figure 13.
(a) Comparison of the monthly mean NH4+ wet deposition between the Base and Bidi scenarios against valid measurements from 231 NADP NTN sites and (b) difference of absolute mean bias plot (Bidi – Base) of the wet deposition at 181 NTN sites for the period from 1 April to 30 September 2011. Note that only sites with more than 50% of data coverage are included in the spatial plot.

