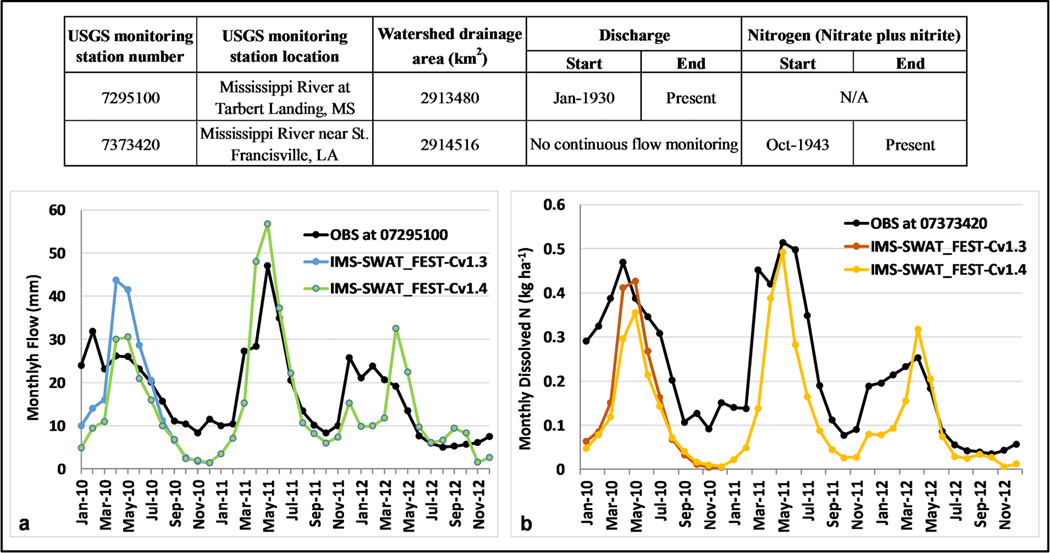
Figure 15.
Comparisons of (a) simulated monthly stream flow (mm) from the integrated Soil and Water Assessment Tool (SWAT) by Fertilizer Emission Scenario Tool for CMAQ (FEST-C) V1.4 (IMS-SWAT_FEST-Cv1.4) and FEST-C V1.3 (IMS-SWAT_FEST-Cv1.3) with the observation at USGS monitoring station 07295100 and (b) dissolved N (kg ha−1) with the measurement at U.S. Geological Survey (USGS) monitoring station 07373420 over the drainage area from 2010 to 2012. USGS monitoring station information is displayed in the top of the figure. Integrated SWAT with FEST-C V1.3 from Yuan et al. (2018) has only 1 year (2010) overlapping with the integrated SWAT simulation with FEST-C V1.4.

