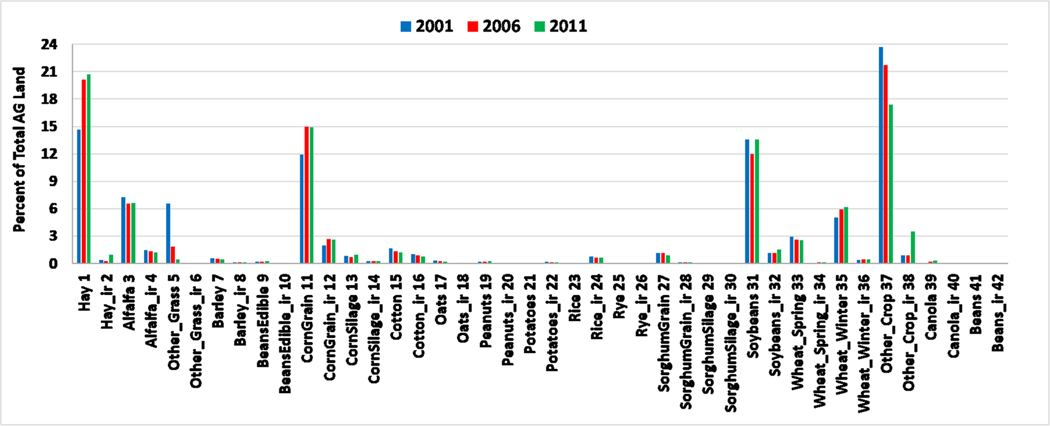
Figure 3.
Percent of the production area to the total agricultural land for Fertilizer Emission Scenario Tool for CMAQ (FEST-C) 2001, 2006, and 2011 land use data sets over the conterminous U.S. domain. X axis—42 grassland and cropland types and names for 2001 (blue), 2006 (red), and 2011 (green). Y axis—percent to the total agricultural land over the corresponding year. Note that types 1 and 2 are for rainfed hay and irrigated hay, and types 3 and 4 for rainfed alfalfa and irrigated alfalfa. The 42 type numbers and names are also listed in Table S1.

