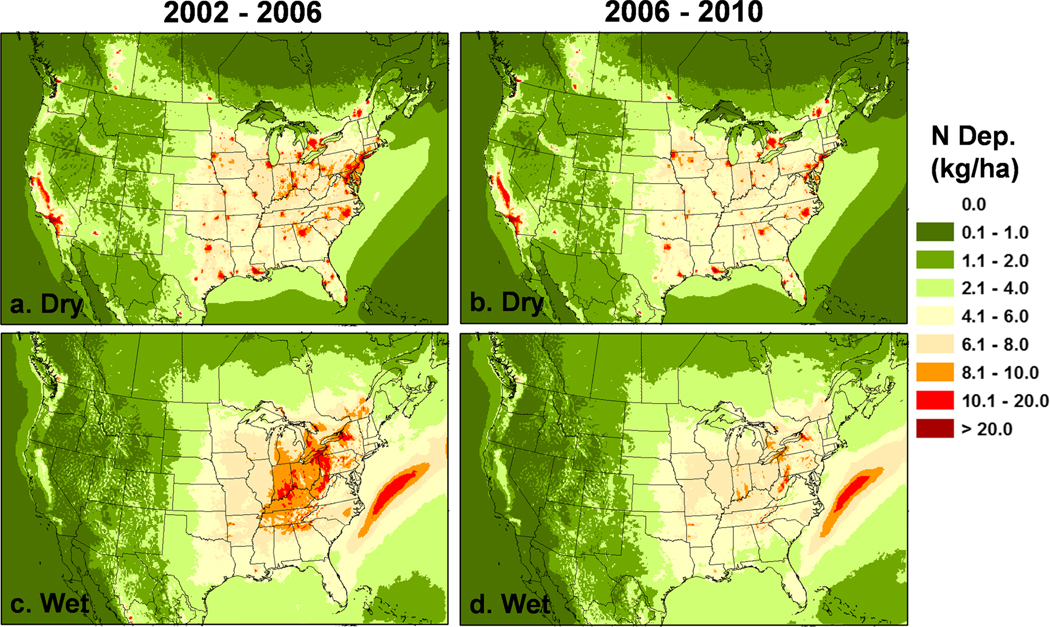
Figure 4.
Yearly total (a and b) dry and (c and d) wet N deposition (kg ·ha−1 · year−1) from the two 5 year average CMAQ simulations (a and c for 2002 to 2006 and b and d for 2006 to 2010) over the conterminous United States (CONUS) 12-km domain cells in Fertilizer Emission Scenario Tool for CMAQ (FEST-C).

