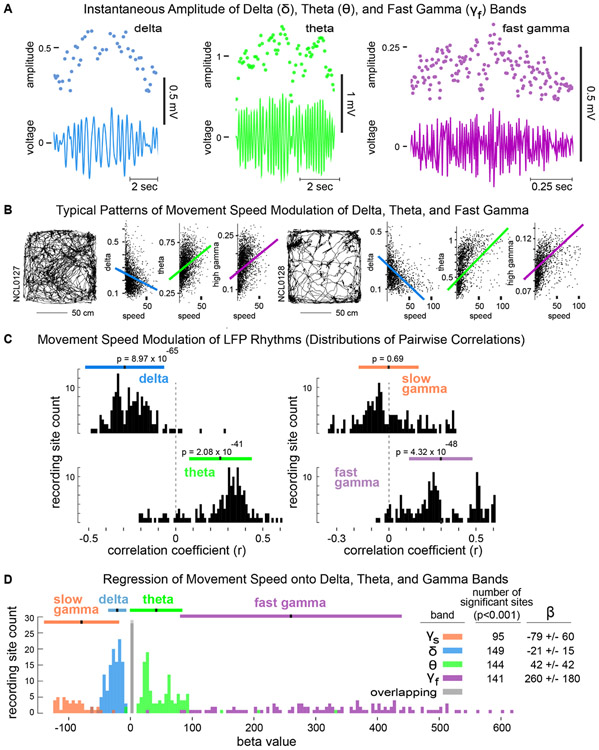
Figure 4. Movement speed modulation of delta, theta, and gamma amplitudes.
A. Instantaneous amplitudes of delta, theta, and gamma were derived from peak-to-trough measurements (dots above) of corresponding band-pass filtered LFPs (voltage traces below). B. Scatterplots of instantaneous amplitudes of delta, theta, and high gamma, and overlaid best-linear-fits, corresponding to rats' locomotor trajectories (left) during two representative sessions. C. Distributions across all rats and recording sites of pairwise correlation coefficients relating the instantaneous amplitude of each frequency band to movement speed. D. Distributions of β-values for significant predictors (p’s<0.001) of movement speed from regressions onto instantaneous amplitudes of delta, theta, and slow and fast gamma bands. The inset table shows the number of recording sites for which each band was a significant predictor and the corresponding mean β-values and standard deviations.

