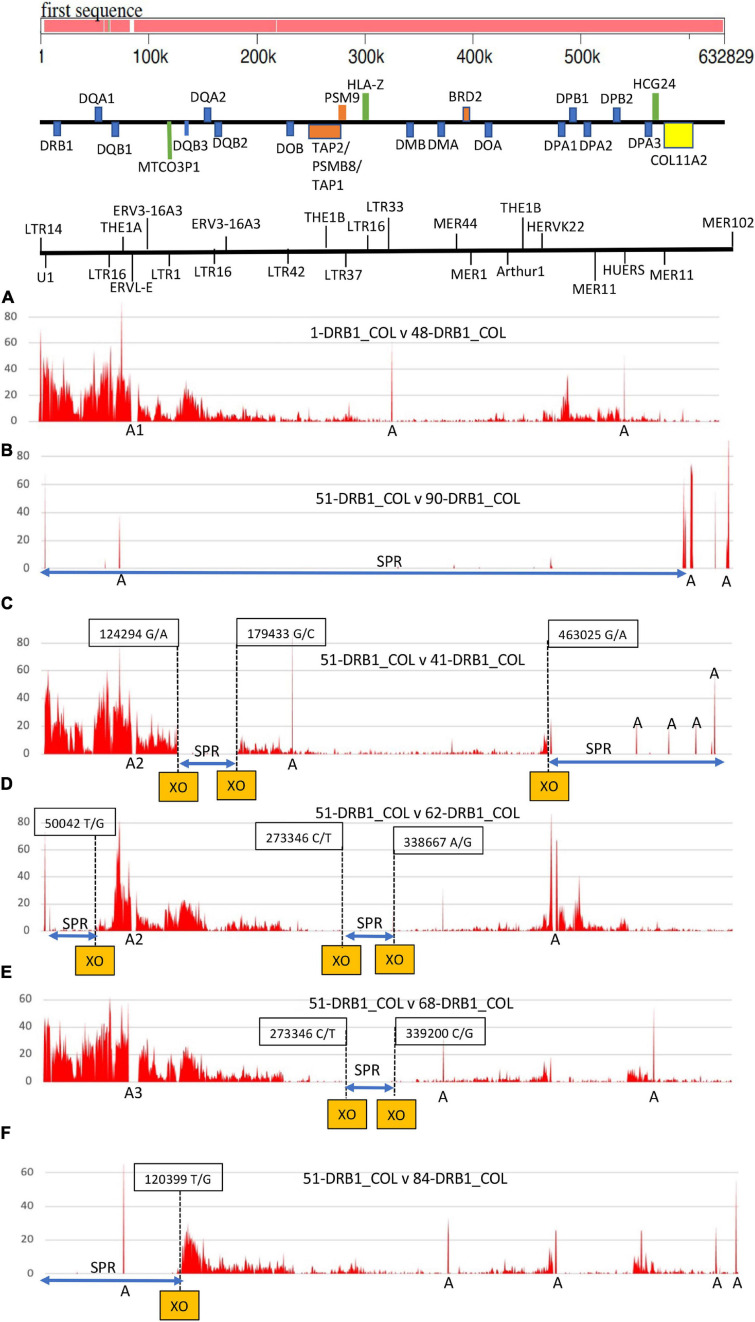
FIGURE 3.
Single-nucleotide polymorphism (SNP) density plots of six pairs of MHC class II haplotypes from HLA-DRB1 to COL11A2. The genomic region and distances for the haplotype sequences are indicated at the top of the Figure with a gene map and an abbreviated TE map highlighting U1 and a few LTR, MER and HERV elements. The six SNP plots are comparisons between (A) 1_ DRB1∗01:01/DQA1∗01:01/DQB1∗05:01:01/MTCO3P1∗09 versus 48_ DRB1∗04:06/DPA1∗02:02/MTCO3P1∗08; and then 51_DRB1∗15:01:01:01/DQA1∗01:02/DQB1∗06:02/MTCO3P1∗02 versus (B) 90_ DRB1∗15:01/DQA1∗01:02/DQB1∗06:02/MTCO3P1∗02, (C) 41_ DRB1∗04:01/DQA1∗03:01/DQB1∗03:02/MTCO3P1∗08, (D) 62_ DRB1∗15:02/DQA1∗01:03/DQB1∗06:01/MTCO3P1∗04, (E) 68_ DRB1∗11:03/DPA1∗01:03/DPB1∗04:02/MTCO3P1∗03, and (F) 84_ DRB1∗15:01:01/DQA1∗01:02:01/DQB1∗06:02/MTCO3P1∗02. The Y-axis presents the number of SNPs per 500 nucleotides (window size). The X-axis shows the SNP positions (SNPs/500 nucleotides) in a block of 632829 nucleotides from HLA-DRB1 to COL11A2 (A–F). The letter ‘A’ along the X-axis marks regions of sequence gaps, poor assembly, inversions or long runs of unspecified nucleotides. ‘A1’ is the position of a MER11/LTR5 indel (TE ID #37 and #38) between 76999 and 79305; ‘A2’ is the position of a 4562-bp LTR5/L1PA10 indel (TE ID #41); and A3 is the position of a 9324-bp indel at 77368-86691 that includes the presence or absence of MER4 and L1PA10 together with the THE1A-AluY-THE1A and LTR5 (see TE IDs #12, #40 and #41 in Table 3 and Supplementary Table 3). The dashed vertical lines mark the SNP-density crossover (XO) points between haplotype pairs. The boxed number is the XO sequence position for sequence ID_51.

