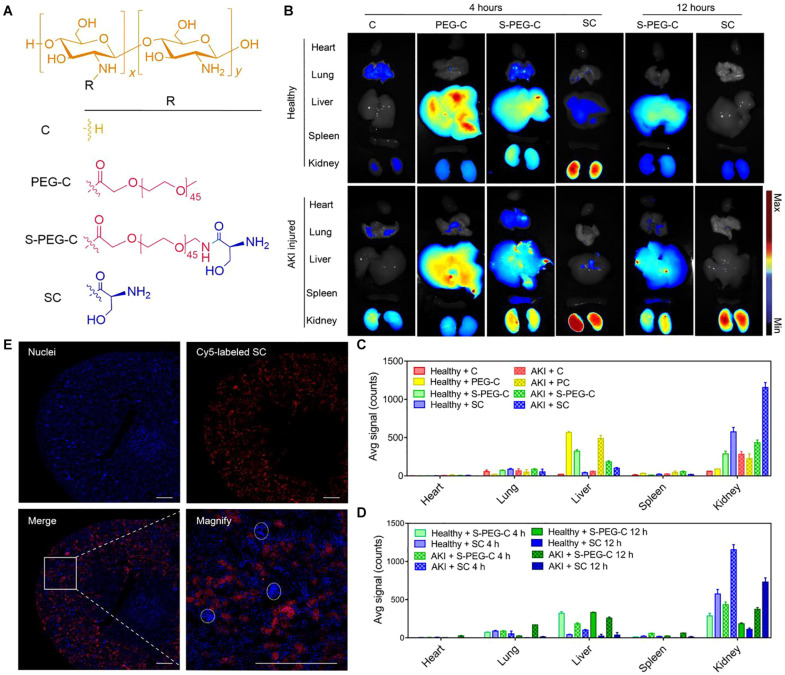
FIGURE 5.
Renal distribution and renal tubules accumulation of l-serine–modified chitosan (SC). Reprinted with permission (Liu et al., 2020). (A) The chemical structures of SC and its analogies (B) Fluorescence images of the main organs (heart, lung, liver, spleen, and kidney) of mice at 4 or 12 h after intravenous injection of Cy5-C, Cy5-PEG-C, Cy5-S-PEG-C, or Cy5-SC. One of three independent experiments is shown. Renal ischemia was induced by clamping of the bilateral renal pedicles for 30 min and then removed clamping to induce IR AKI. After the initiation of AKI, fluorescence-labeled SC and its analogies were administered intravenously. Four or twelve hours later, the main organs were harvested for fluorescence visualization. The healthy mice were treated with the same protocol as control. (C,D) Region of interest analysis of the kidney uptake at 4 and 12 h after injection. The data are the means ± SD. n = 3 independent mice. (E) Representative confocal images of kidney sections after intravenous injection of Cy5-SC (red signal) for 4 h. Blue indicates 4′,6-diamidino-2-phenylindole (DAPI) staining. White dashed circles denote glomeruli. Scale bars, 500 μm.

