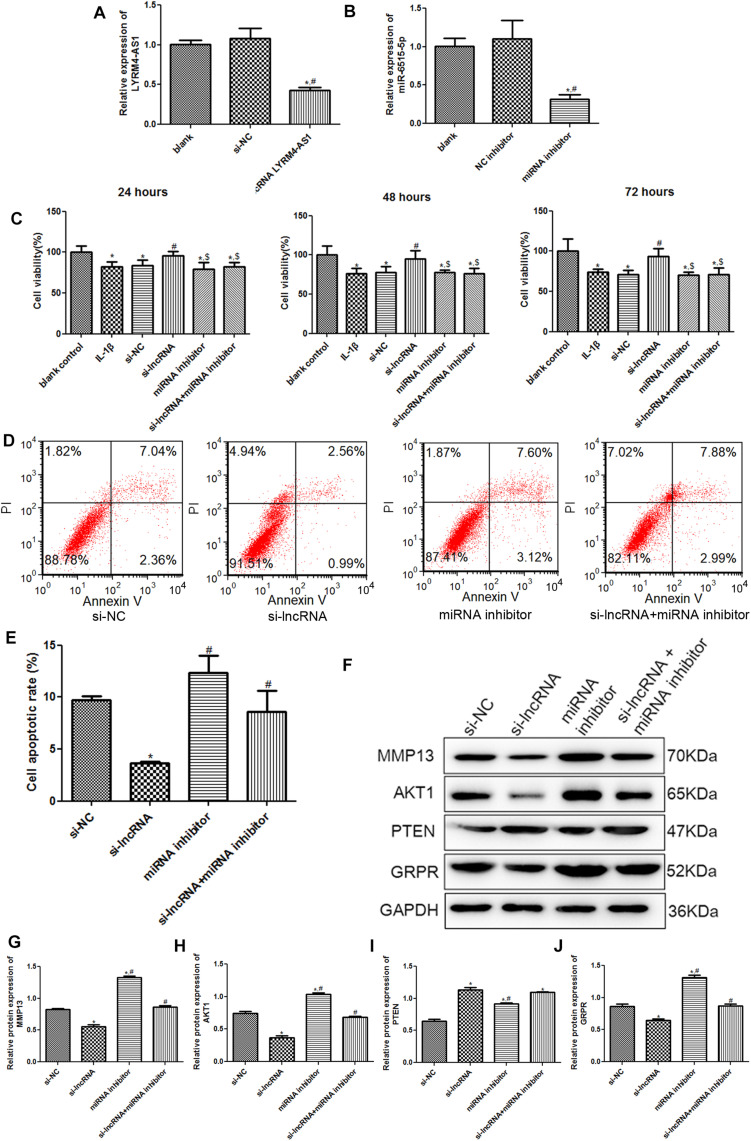
FIGURE 6.
(A) The relative expression of lncRNA LYRM4-AS1 after transfection. n = 3. *P < 0.05 vs. blank group; #P < 0.05 vs. si-NC group. (B) The relative expression of miR-6515-5p after transfection. n = 3. *P < 0.05 vs. blank group; #P < 0.05 vs. NC inhibitor group. (C) After cell transfection, the cell viability of chondrocytes was examined using CCK-8 assay. n = 3. *P < 0.05 vs. blank control group; #P < 0.05 vs. IL-1β group. $P < 0.05 vs. si-lncRNA LYRM4-AS1 group. (D) The images of cell apoptosis acquired by flow cytometry. (E) The cell apoptosis rate of chondrocytes after transfection analyzed by CellQuest software. n = 3. *P < 0.05 vs. si-NC group; #P < 0.05 vs. si-lncRNA LYRM4-AS1 group. (F) The protein bands of MMP13, AKT1, PTEN, and GRPR detected by western blot. The relative protein expression of MMP13 (G), AKT1 (H), PTEN (I), and GRPR (J) in different groups. n = 3. *P < 0.05 vs. si-NC group; #P < 0.05 vs. si-lncRNA group.

