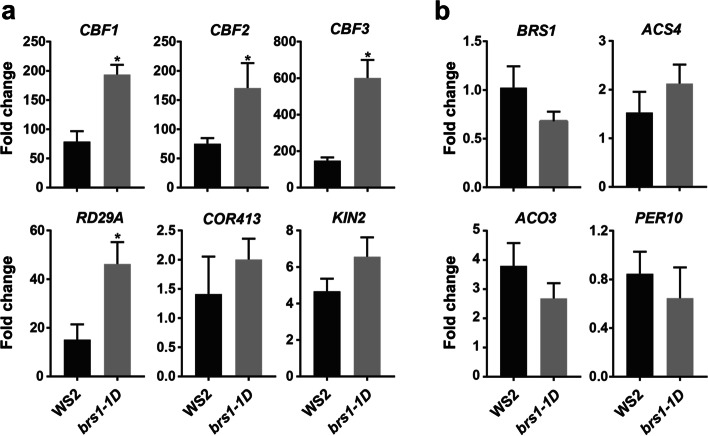
Fig. 4.
The brs1-1D shows a higher cold sensitivity. The qRT-PCR was performed in each genotype with and without freeze treatment (4 ℃ for 3 h). The columns represent the fold change of gene expression after freeze treatment compared to untreated control. All results are shown as mean ± SD from three biological replicates at least. The asterisks indicate a statistically significant difference (Student’s t -test, *p < 0.05). a Cold signaling genes responses with freeze treatment. b Stress related genes response with freeze treatment. Including ethylene synthesis related genes (ACS4 and ACO3) and redox related gene PER10

