Fig. 6.
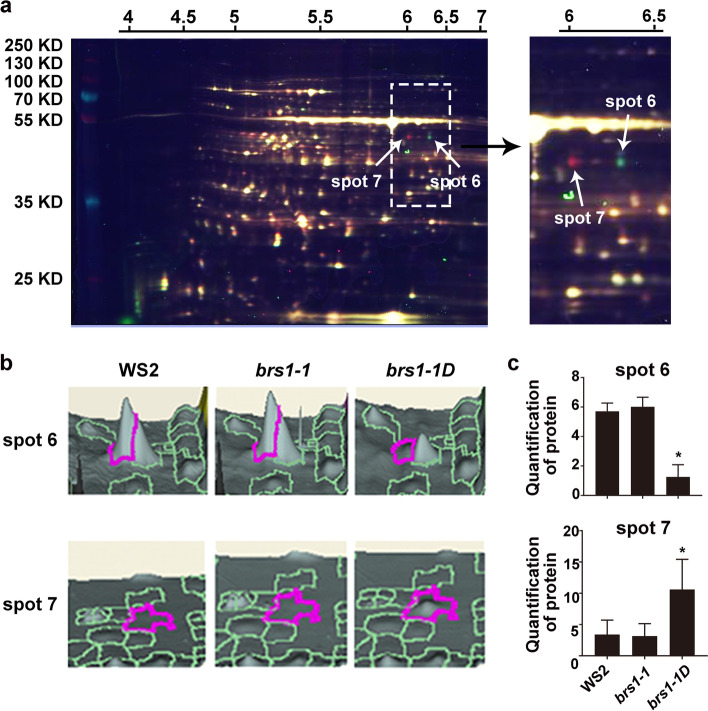
Identification of two isoforms of cICDH and comparison of protein expression levels. a Representative 2D-DIGE image. Samples from WS2, brs1-1 and brs1-1D were labeled with Cy2 (blue), Cy3 (green), and Cy5 (red), respectively. The x- and y-axis represent the isoelectric point and molecular weight of the protein, respectively. White arrows indicate differential protein spots. b Expression levels of two differential protein spots in WS2, brs1-1 and brs1-1D. The height of the pink circled area represents the level of protein expression. c The protein quantification of spot 6 and 7 in WS2, brs1-1 and brs1-1D. The Y-axis represents the normal volume of differential protein spots. All results are shown as mean ± standard deviation (SD) from three biological replicates. The asterisks indicate a statistically significant difference (Student’s t-test, *p < 0.05)

