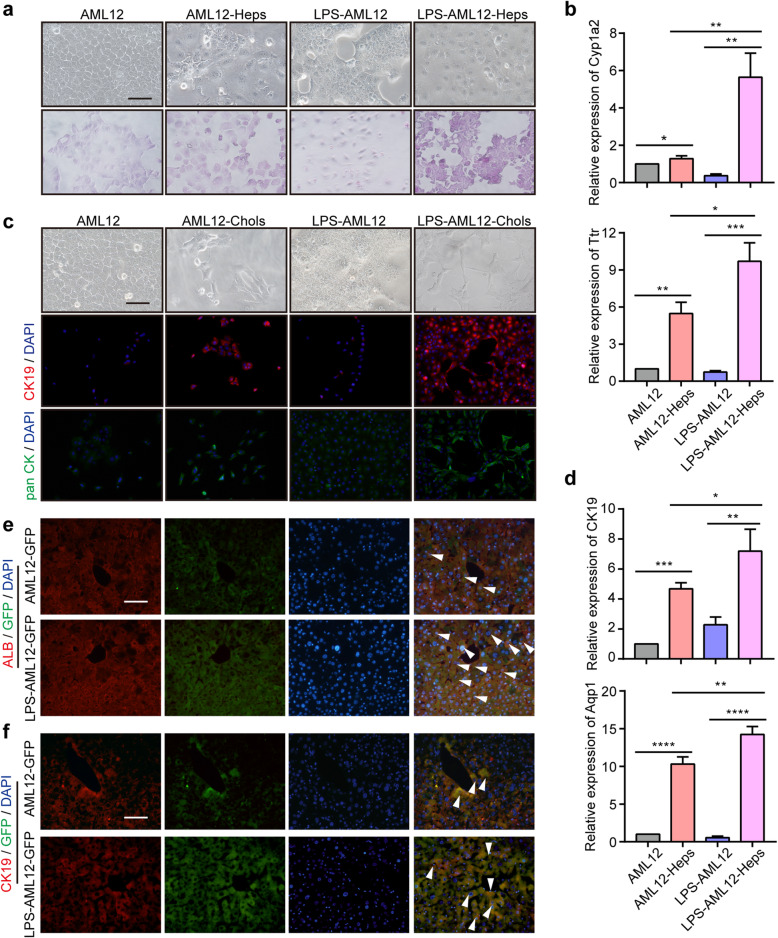
Fig. 4.
LPS-induced hepatocytes exhibit bipotent differentiation potential in vitro and in vivo. a Upper: Representative phase-contrast images of AML12 and LPS-AML12 cells with (right) or without (left) hepatic induction. Bottom: Representative images of PAS staining. Scale bars, 50 μm. b The relative expression of the mature hepatic marker Cyp1a2 and Ttr in AML12 cells, AML12-Heps, LPS-AML12 cells, and LPS-AML12-Heps as determined by qRT-PCR. c Representative phase-contrast images and IF staining of CK19 and pan CK in AML12 cells and LPS-AML12 cells with (right) and without (left) biliary induction. Scale bars, 50 μm. d qRT-PCR analysis of the cholangiocyte marker CK19 and Aqp1 in AML12 cells, AML12-Chols, LPS-AML12, and LPS-AML12-Chols. e IF staining of the mature hepatocyte markers ALB (red) . The arrowheads denote AML12-GFP cells and LPS-AML12-GFP cells with ALB staining. Scale bars, 50 μm. f IF staining of live chimaeric Fah-/- mice for the cholangiocyte markers CK19 (red). The arrowheads denote AML12-GFP cells and LPS-AML12-GFP cells with CK19 staining. LPS-AML12: AML12 cells were cultured in reprogramming medium in the presence of LPS for 2 weeks. Scale bars, 50 μm. *P < 0.05, **P < 0.01, ***P < 0.001

