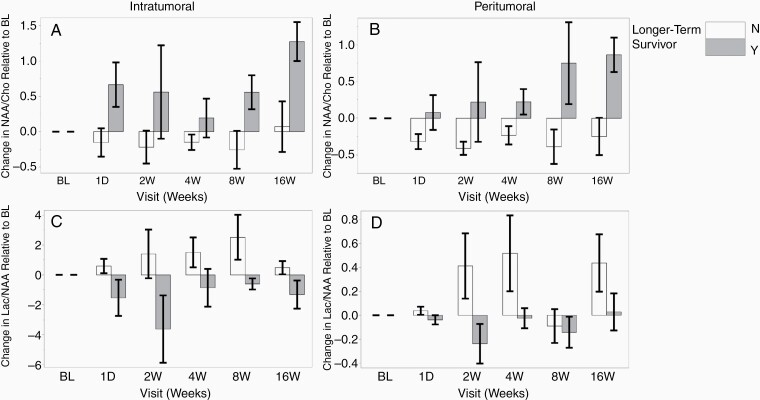
Figure 4.
Intratumoral and peritumoral changes in NAA/Cho and Lac/NAA relative to BL scan. Longer-term survivors have higher NAA/Cho levels relative to shorter-term survivors in the tumor (A) and peritumoral area (B) across different time points. Lac/NAA is higher in shorter-term survivors compared to longer-term survivors in tumor voxels (C) and in most time points in the peritumoral area except the 8-week time point (D). Error bars represent standard error.

