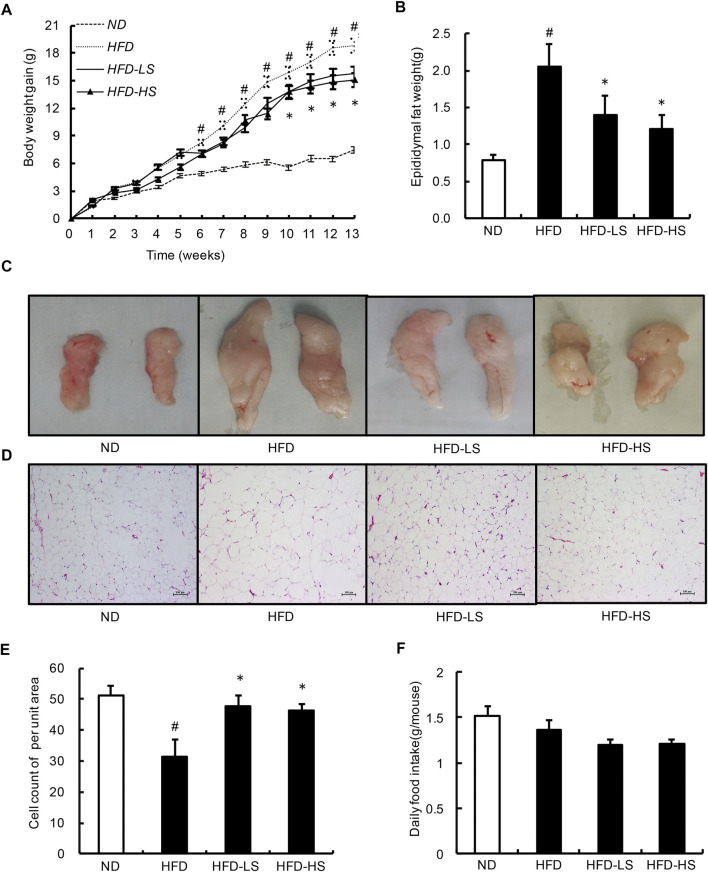
FIGURE 4.
Sal A lowered body weight gain and decreased the eWAT mass and the size of adipocytes within eWAT. (A) Change in body weight gain. and (B) the eWAT mass. (C) Morphological photographs of epididymal fat. (D) H&E staining of eWAT to observe the size of adipocytes, scale bar = 100 μm; and (E) the cell count of per unit area in H&E-stained sections. (F) The daily food intake. # reflects comparing with normal diet (ND) group; * reflects comparing with high-fat diet (HFD) group. All groups contain 12 animals (n = 12).

