Figure 3.

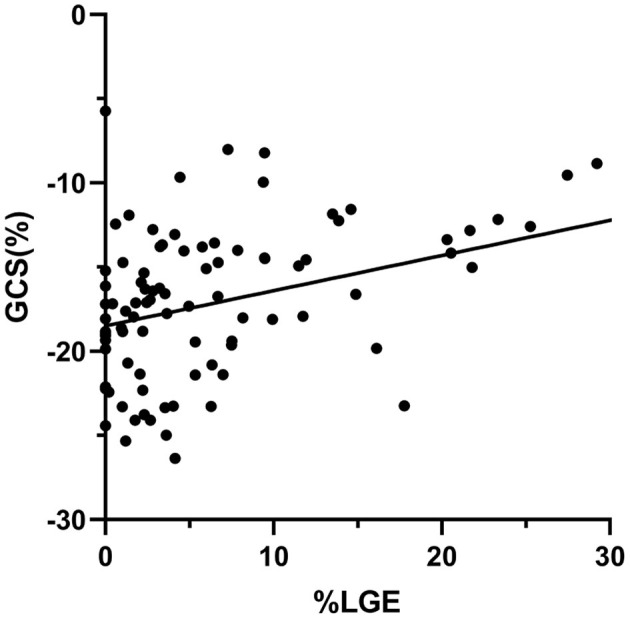
Scatter plots of correlation analysis between GCS and %LGE. GCS and %LGE were correlated moderately (r = 0.51, P < 0.001). GCS, global circumferential strain; LGE, late gadolinium enhancement.

Scatter plots of correlation analysis between GCS and %LGE. GCS and %LGE were correlated moderately (r = 0.51, P < 0.001). GCS, global circumferential strain; LGE, late gadolinium enhancement.