
Figure 5.
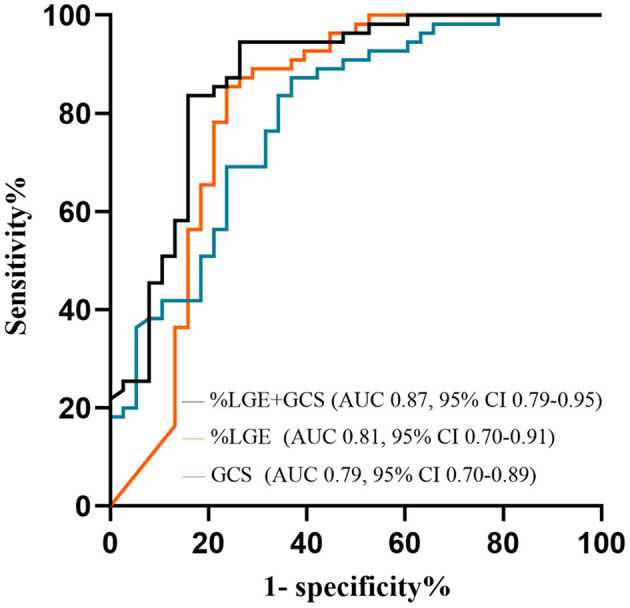
ROC curves to assess the ability of %LGE and GCS in identifying HCM patients with VAs. AUC, area under the curve; GCS, global circumferential strain; HCM, hypertrophic cardiomyopathy; LGE, late gadolinium enhancement; ROC, receiver operator characteristic; VA, ventricular arrhythmia.