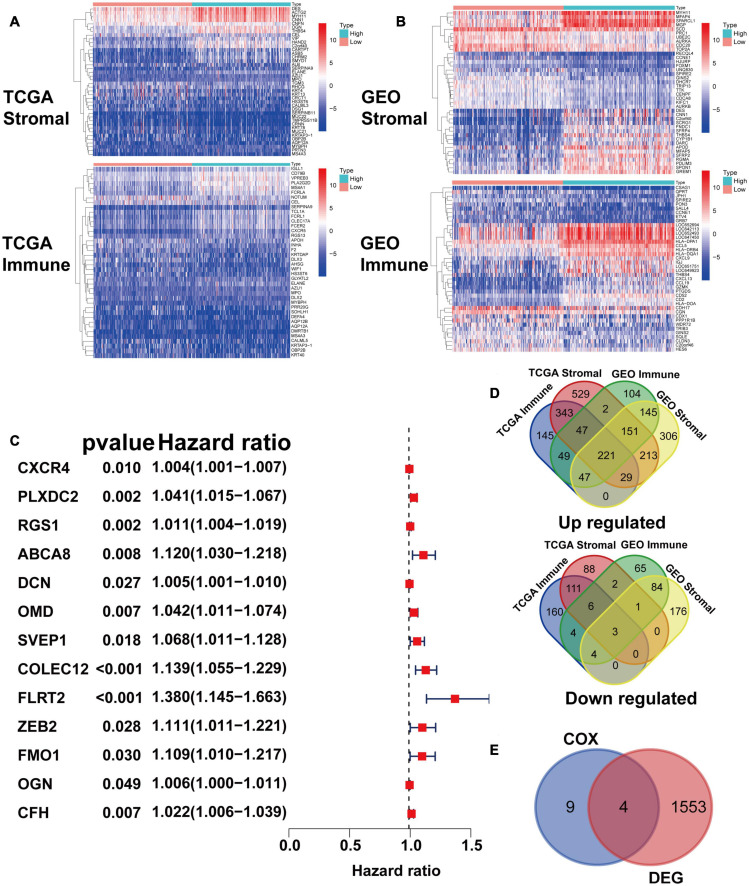
FIGURE 2.
Identification of prognostic gene markers according to patients’ stromal and immune scores. (A) Heatmaps of the top 20 DEGs generated by comparing the high stromal/immune score group and the low stromal/immune score groups of TCGA STAD patients. The heatmaps’ row name is the gene name, and the ID of the samples is the column name, which is not shown in the plot. DEGs were determined by the Wilcoxon rank sum test with q = 0.05 and | fold change| (FC) > 1 after log2 transformation as the thresholds for significance. (B) Heatmaps of DEGs in GEO patients, similar to (A). (C) Venn plots generated via an online tool (http://bioinformatics.psb.ugent.be/webtools/Venn/) depicting the up-regulated and down-regulated DEGs shared by the TCGA STAD and GEO datasets. (D) Forest plot of Cox regression (with 95% confidence interval), which was conducted with the 224 DEGs. (E) Venn plot depicting genes that were both related to survival and differentially expressed between tumor samples and normal samples.

