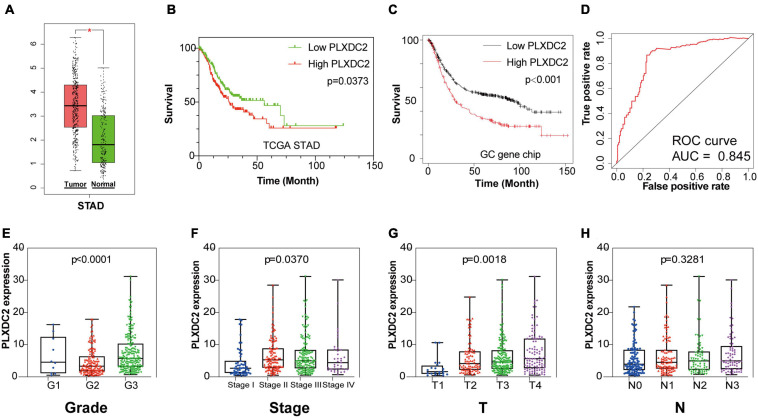
FIGURE 3.
PLXDC2 is a DEG capable of propelling GC progress. (A) Differential expression of PLXDC2 in normal and tumor samples generated by GEPIA2. Analyses were performed across normal and tumor samples of TCGA STAD alongside GTEx normal samples. (B) Survival analysis of TCGA STAD patients with different PLXDC2 expression levels. Patients were sorted into high expression or low expression groups according to the median expression level (p = 0.0373 by log-rank test). (C) Survival curves of GC patients generated by Kaplan–Meier Plotter (p < 0.0001 by log-rank test). (D) ROC curve for PLXDC2. An AUC close to 1 suggests high reliability. (E–H) The relationship between PLXDC2 expression and tumor grade, clinical stage, T stage and N stage. Each dot signifies the PLXDC2 expression level in a sample.

