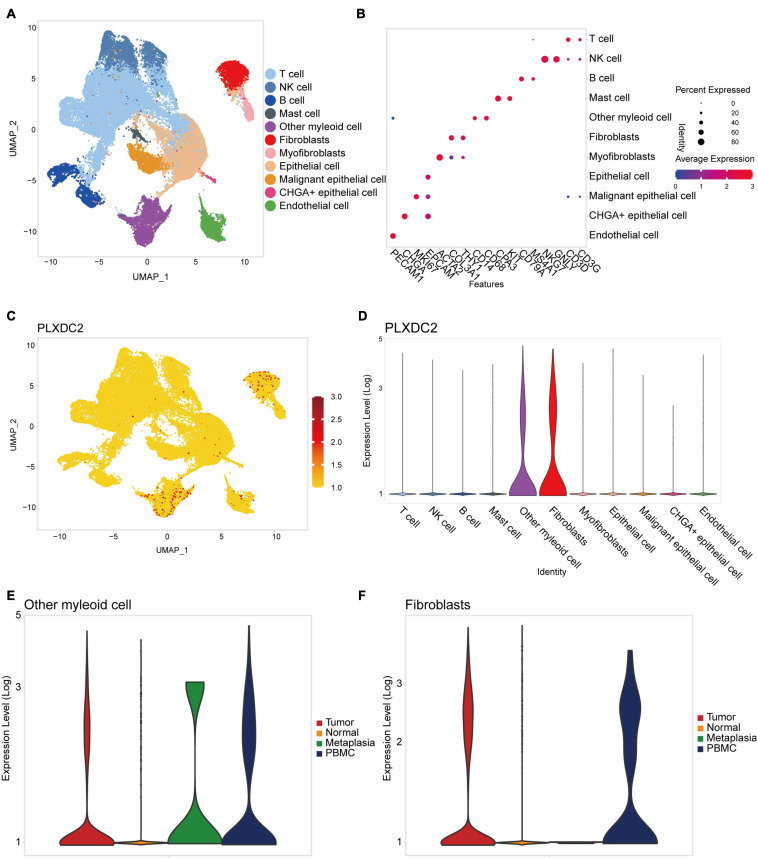
FIGURE 6.
PLXDC2 expression level ascend in Fibroblasts and Macrophages. (A) Uniform manifold approximation and projection (UMAP) dimensionality reduction analysis. 11 cell types were identified with its unique gene marker. Other myeloid cell represents monocytes and macrophages. (B) Bubble plot demonstrating each cell type and its gene marker. (C) UMAP revealing the expression level of PLXDC2. Higher expression is indicated with a redder color. (D) Violin plot showing the expression of PLXDC2 in each cell type. (E) Violin plot showing the expression level of PLXDC2 in other myeloid cell of Metaplasia, Normal, PBMC and Tumor samples, metaplasia represents the transformation of one differentiated cell type to another differentiated cell type, and PBMC resembles peripheral blood mononuclear cell. (F) Violin plot showing the expression level of PLXDC2 in fibroblasts of Metaplasia, Normal, PBMC and Tumor samples, similar to (E).

