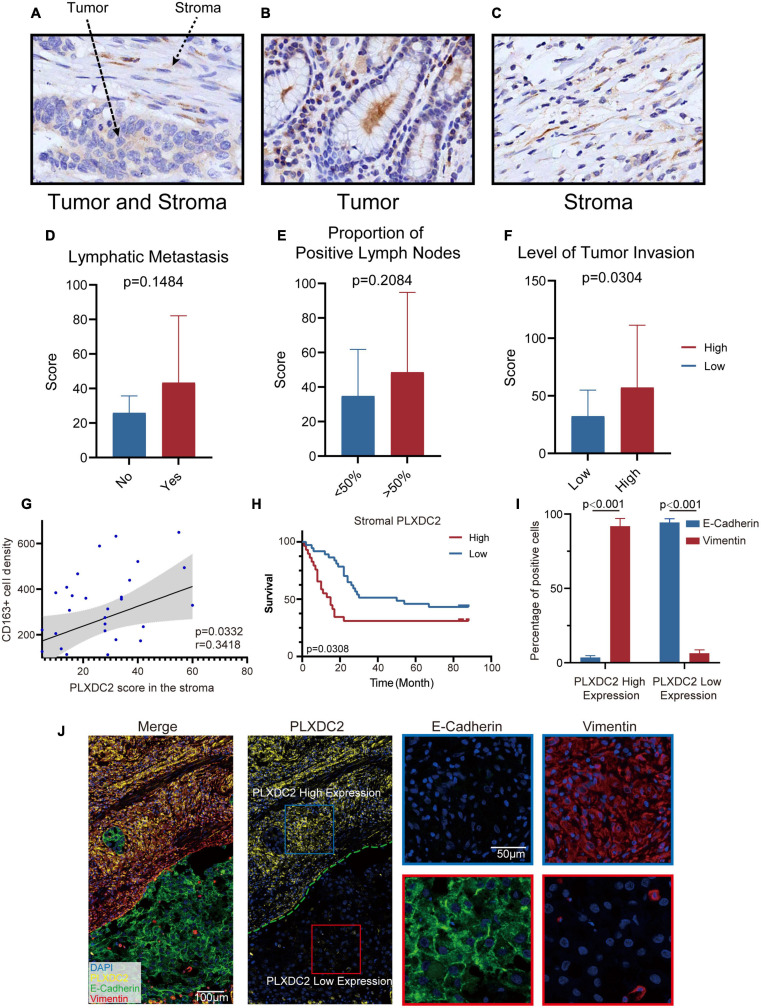
FIGURE 7.
PLXDC2 upregulation in Stroma indicates poor survival and high tumor invasion level. (A) PLXDC2 IHC staining images of GC tumor and stromal tissues (20x). (B) PLXDC2 IHC staining images of GC stromal tissues (20x). (C) PLXDC2 IHC staining images of GC tumor tissues [20x; (D)] PLXDC2 staining scores of GC tumor tissues in samples group by whether lymphatic metastasis exist. Lymphatic Metastasis is consistent with N in AJCC standard. A paired t test was used for analysis. (E) PLXDC2 staining scores of GC tumor tissues in the samples group by comparing with 50% of the positive lymph nodes. The proportion of Positive Lymph Nodes refers to the proportion of positive lymph nodes in lymph nodes removed during operation. A paired t test was used for analysis. (F) PLXDC2 staining scores of GC tumor tissues in samples group by level of tumor invasion (high vs. low). Level of Tumor Invasion is consistent with T in AJCC standard. A paired t test was used for analysis. (G) Scatter plot showing the correlation of PLXDC2 score in the stroma and CD163+ cell density (p = 0.0332, r = 0.3418). (H) Kaplan–Meier plot assessing survival according to High and Low PLXDC2 score in the stroma. p = 0.0308 by log-rank test. (I) mIHC staining scores exhibiting the percentage of positive cells of GC tumor tissues group by PLXDC2 expression level [high vs. low, p < 0.001; (J)] mIHC staining images of GC section (Merge and PLXDC2-10x, E-Cadherin and Vimentin-40x).

