
FIG. 19.
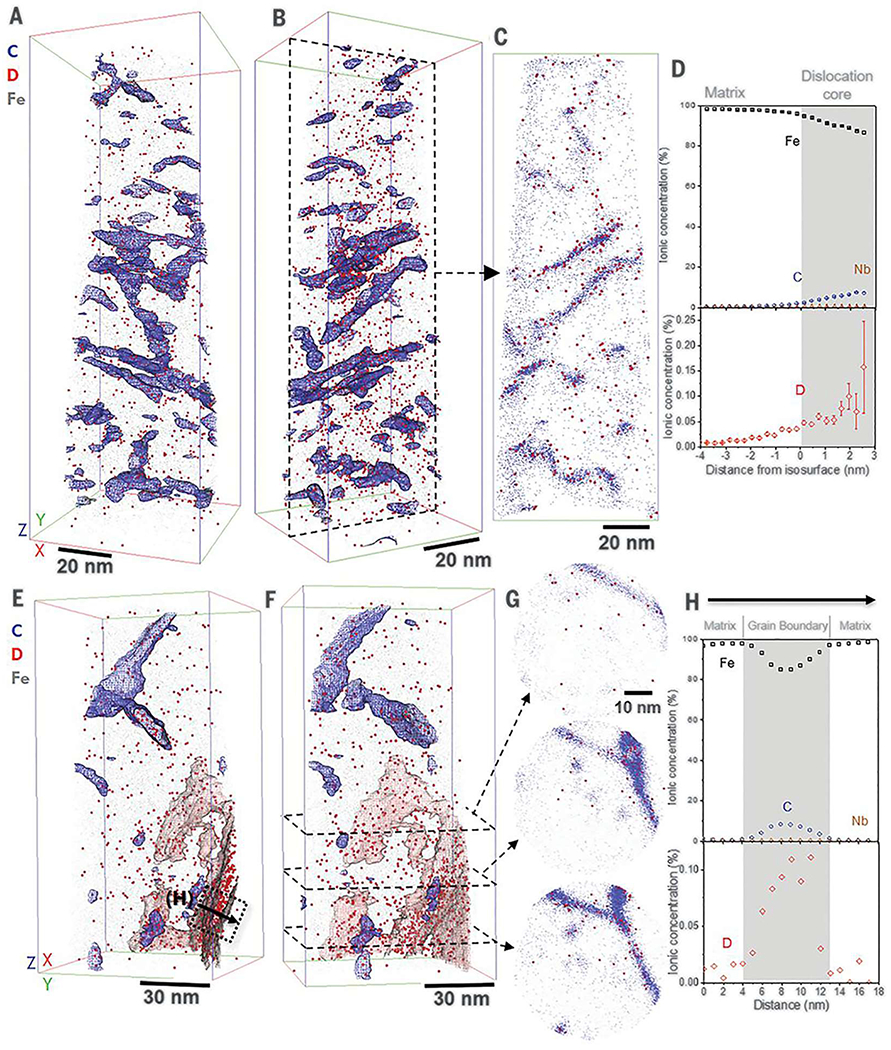
APT analyses of deuterium-charged martensite steel. The first dataset [(a)–(d)] contains only dislocations, whereas the second dataset [(e)–(h)] contains both dislocations and grain boundaries. The dislocations and grain boundaries are highlighted by transparent blue and red isosurfaces, respectively. Reprinted from Chen et al., Science 367, 171 (2020).243 Copyright 2020 AAAS.