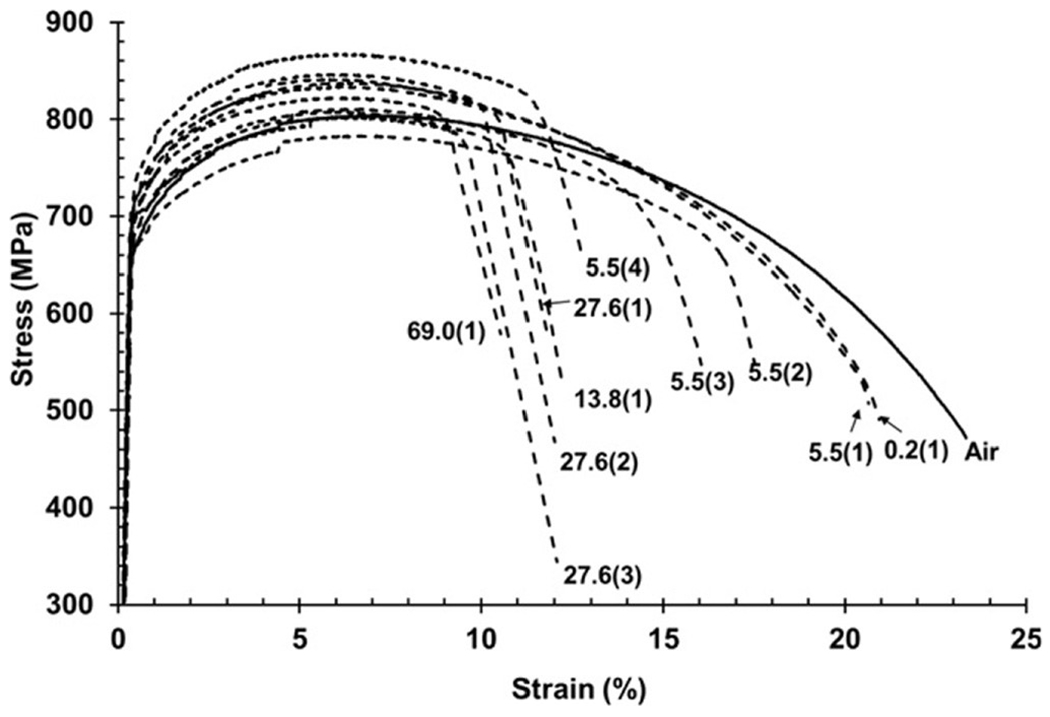
FIG. 6.

Tensile curves from longitudinal X100 steel specimens tested in hydrogen at different gas pressures and a strain rate of 7 × 10⁻³ s−1. The hydrogen gas pressure in MPa is provided at the end of each tensile curve. Numbers in parentheses represent repeat specimens. This figure demonstrates that elongation to failure generally decreases as the hydrogen gas pressure increases, and that this effect seems to plateau. Moreover, there is no change in yield strength as a function of pressure, and that changes in ultimate tensile strength do not show a definite correlation with pressure. Reprinted from Nanninga et al., Corros. Sci. 59, 1 (2012).80
