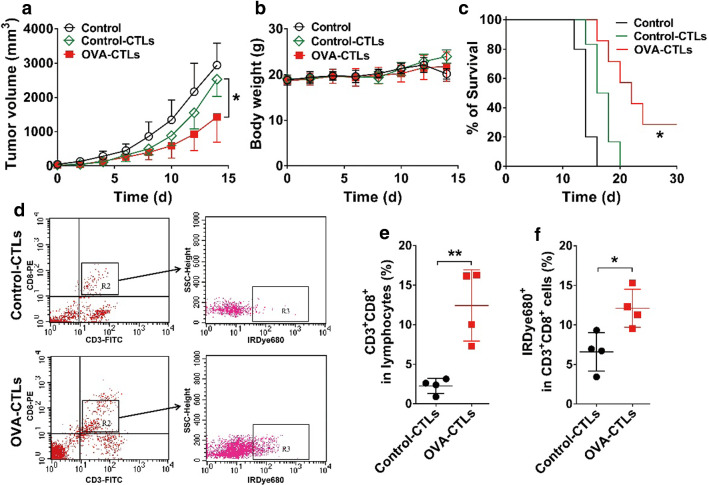
Fig. 2.
Antitumor effect and tumor accumulation of adoptive OVA-specific cytotoxic T lymphocytes (OVA-CTLs) in B16-OVA tumor-bearing C57BL/6 mice. a–c Tumor growth curves (a), body weights (b), and survival curves (c) of B16-OVA tumor-bearing C57BL/6 mice after intravenous injection of PBS (n = 5), control-CTLs (5 × 10⁵ cells every day for 4 days; n = 6), or OVA-CTLs (5 × 10⁵ cells every day for 4 days; n = 6). (d–f) Representative dot plots (d), quantification of CD8+ T cells (CD3+CD8+) (e), and the percentage of IRDye680-labled CTLs in CD3+CD8+ T cells (f) determined using flow cytometric analysis of single-cell suspensions derived from B16-OVA tumors harvested from C57BL/6 mice (n = 4/group) after the injection of IRDye680-labeled control-CTLs or IRDye680-labeled OVA-CTLs. Data are presented as mean ± SD. *, P < 0.05; **, P < 0.01

