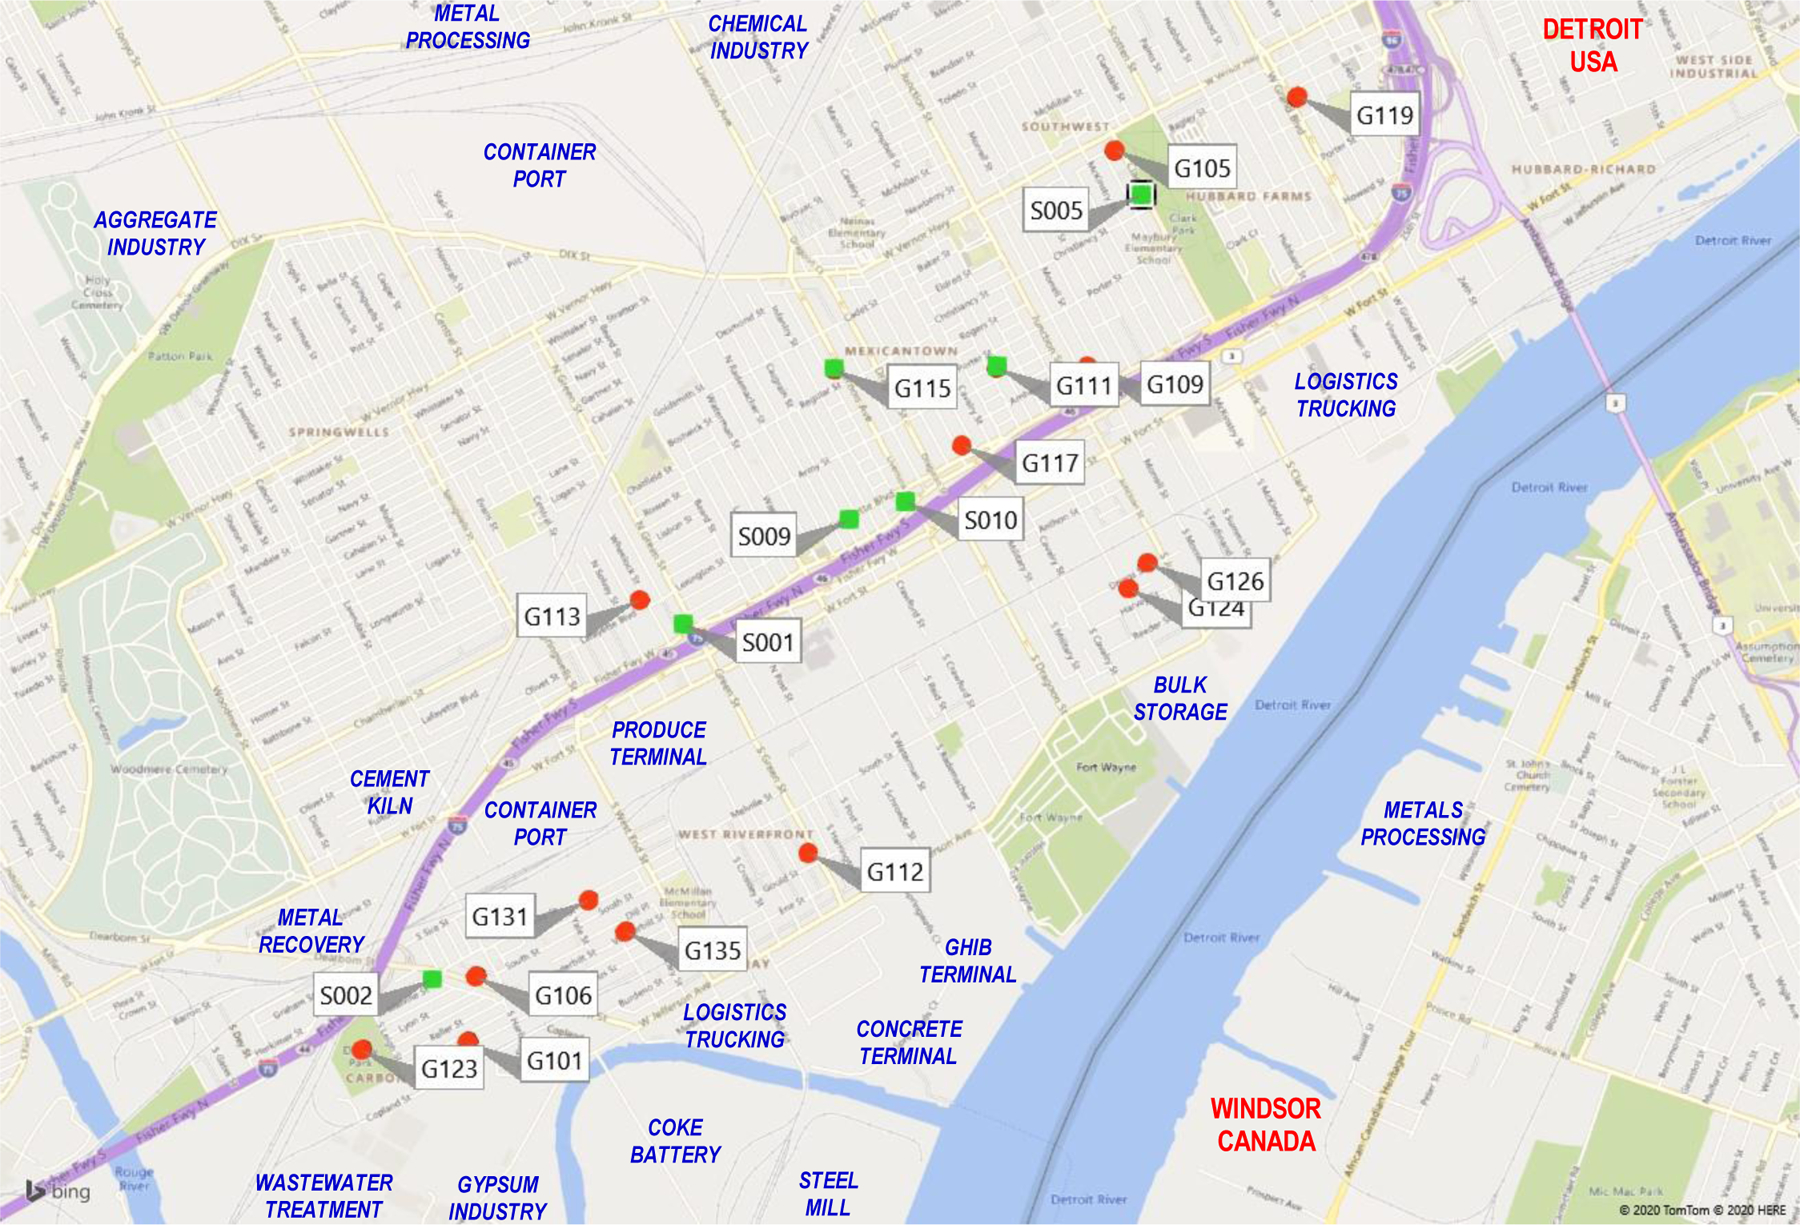
Fig. 1.

Site map indicating locations of monitoring sites with S sites are in red and G sites in green. S003 is also G111, and S07 is G115. Also shows location of larger industries. GHIB = construction area for new bridge. Map spans 5.4 × 4.5 km region. Map from Bing (2020).
