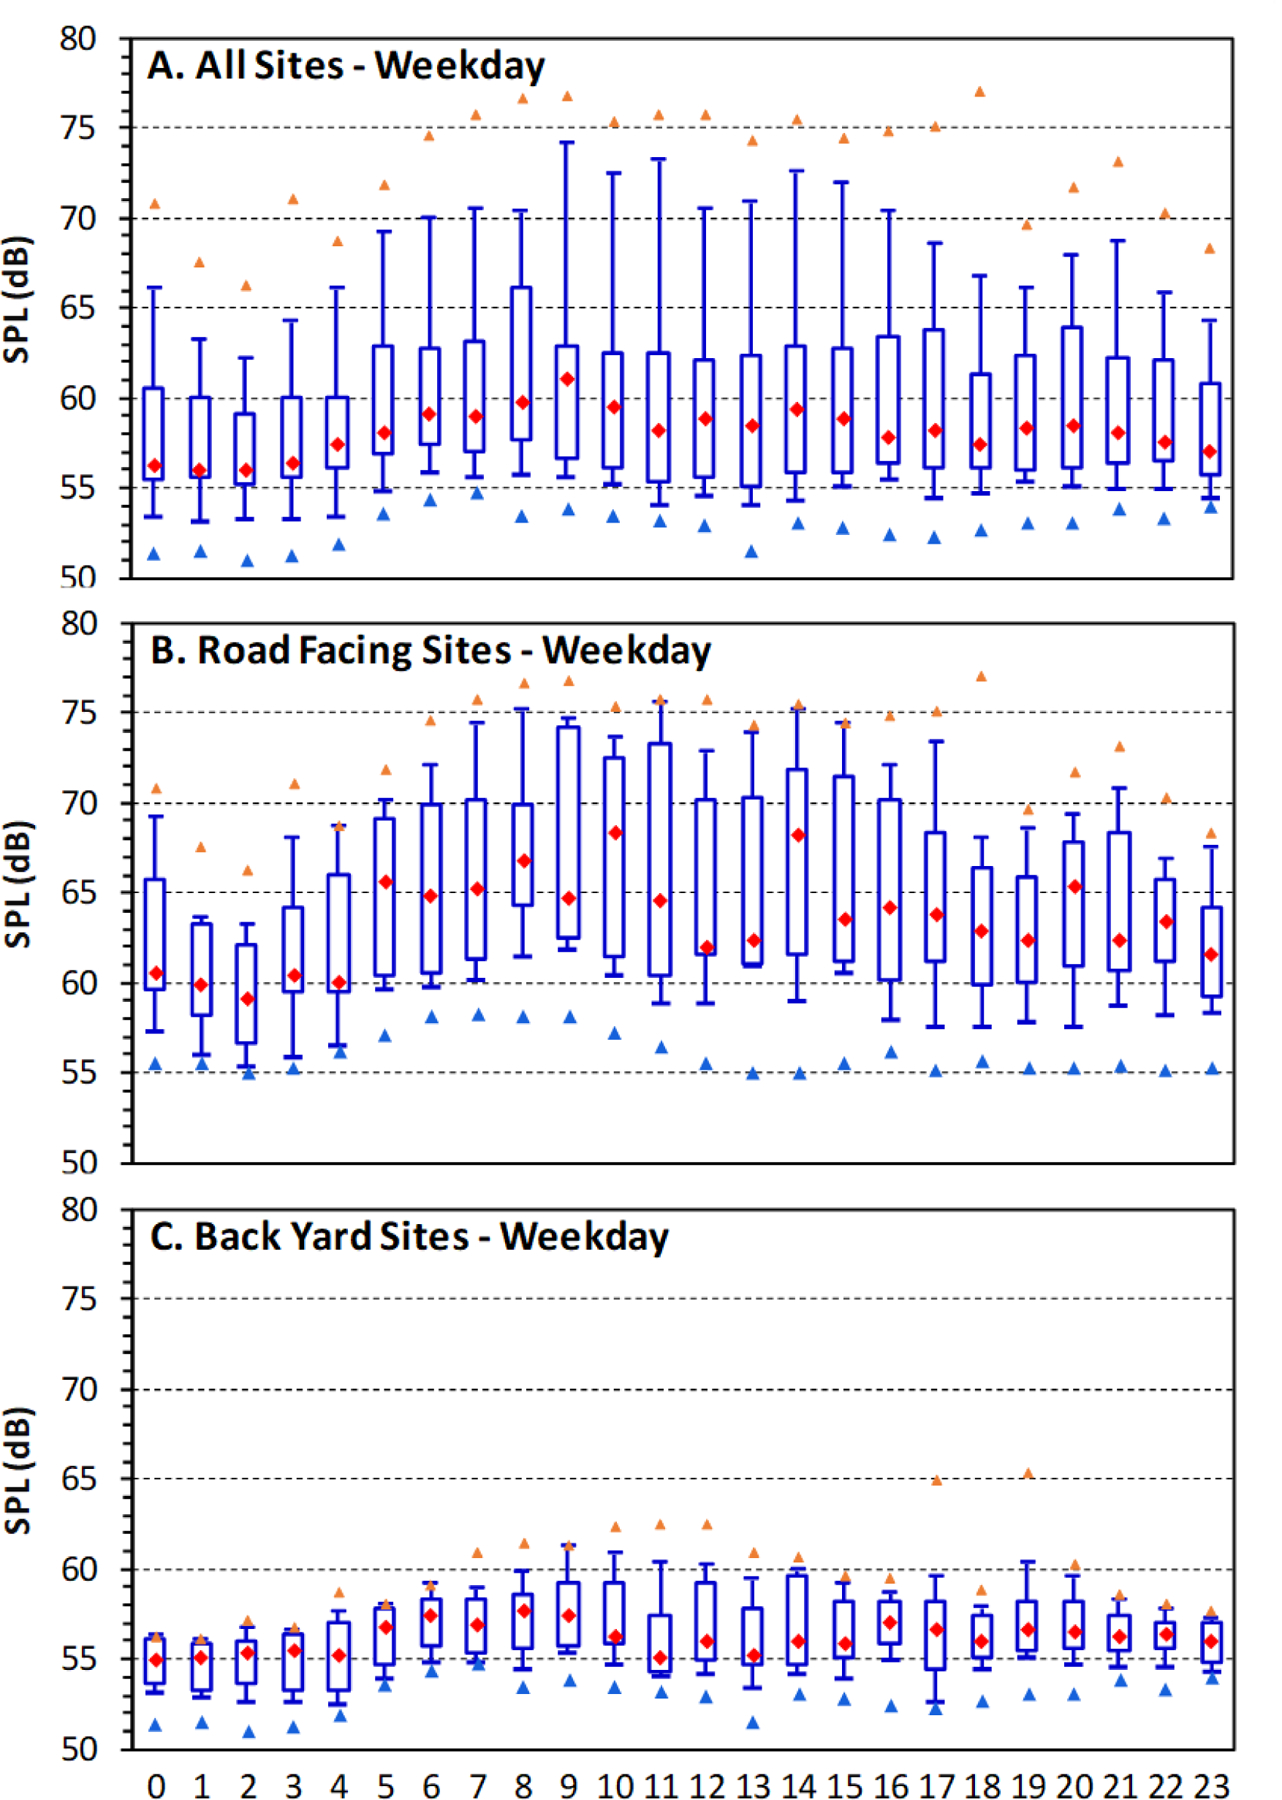
Fig. 3.

SPLs by time of day for all sites (N=21), road-facing sites (N=11), and sites located in back or side yards (N=10). Uses 1-hr SPL. Plots show maximum, 90th, 75th, median (as red diamond), 25th, 10th percentile and minimum 1-hr Leq across the sites.
