Fig. 5.

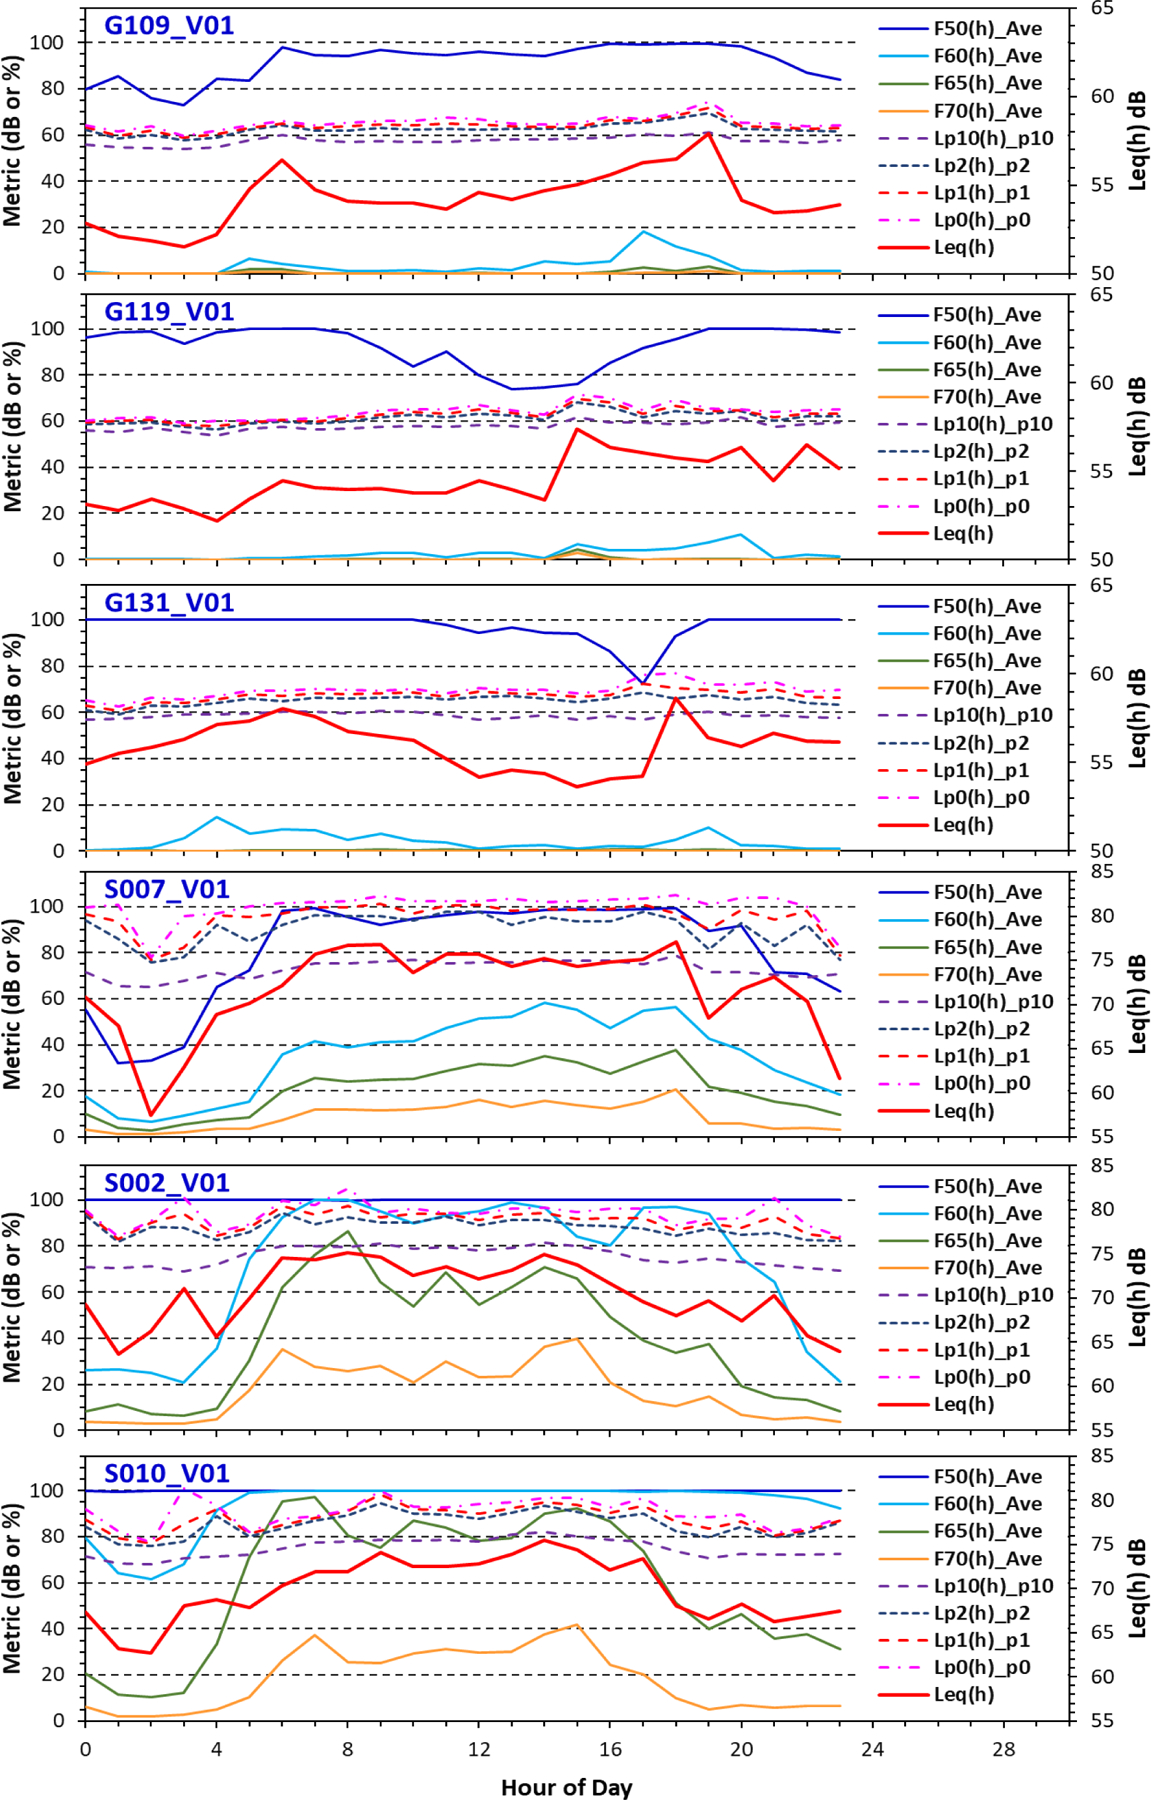
1 day of hourly noise metrics at the three quietest (G109, G131, G119) and noisiest sites (S010, S001, S002). SPL average Lave(h) uses right-hand scale. Scales change for the noisy sites.

1 day of hourly noise metrics at the three quietest (G109, G131, G119) and noisiest sites (S010, S001, S002). SPL average Lave(h) uses right-hand scale. Scales change for the noisy sites.