
Fig. 6.
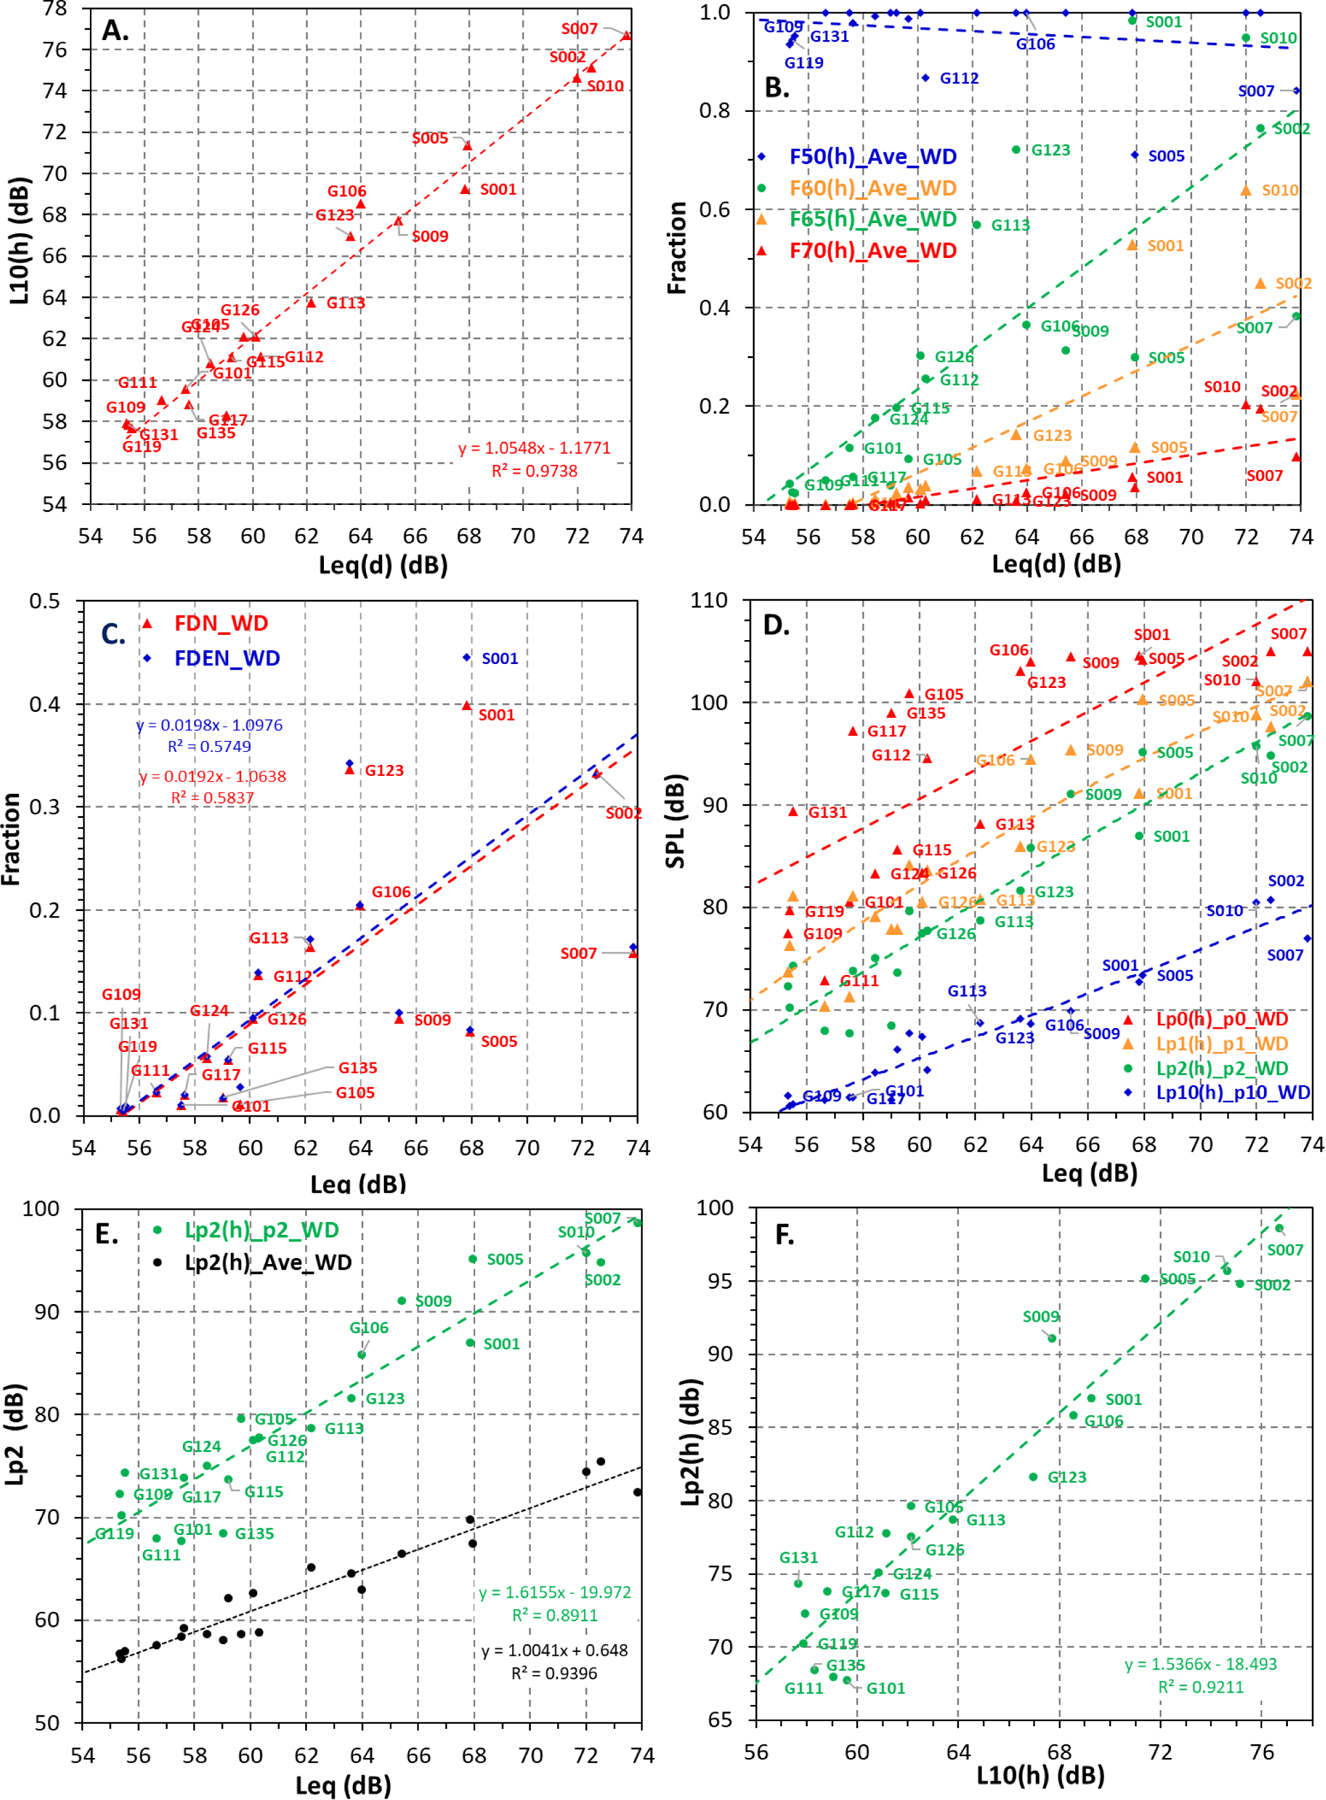
Relationship between peak and fraction measures with average equivalent SPL Leq(d) (A–E), and 98th percentile peak and 98th percentile SPL metric Lp2(h) (E). All plots use weekday data (N=21).
Official websites use .gov
A
.gov website belongs to an official
government organization in the United States.
Secure .gov websites use HTTPS
A lock (
) or https:// means you've safely
connected to the .gov website. Share sensitive
information only on official, secure websites.
Relationship between peak and fraction measures with average equivalent SPL Leq(d) (A–E), and 98th percentile peak and 98th percentile SPL metric Lp2(h) (E). All plots use weekday data (N=21).