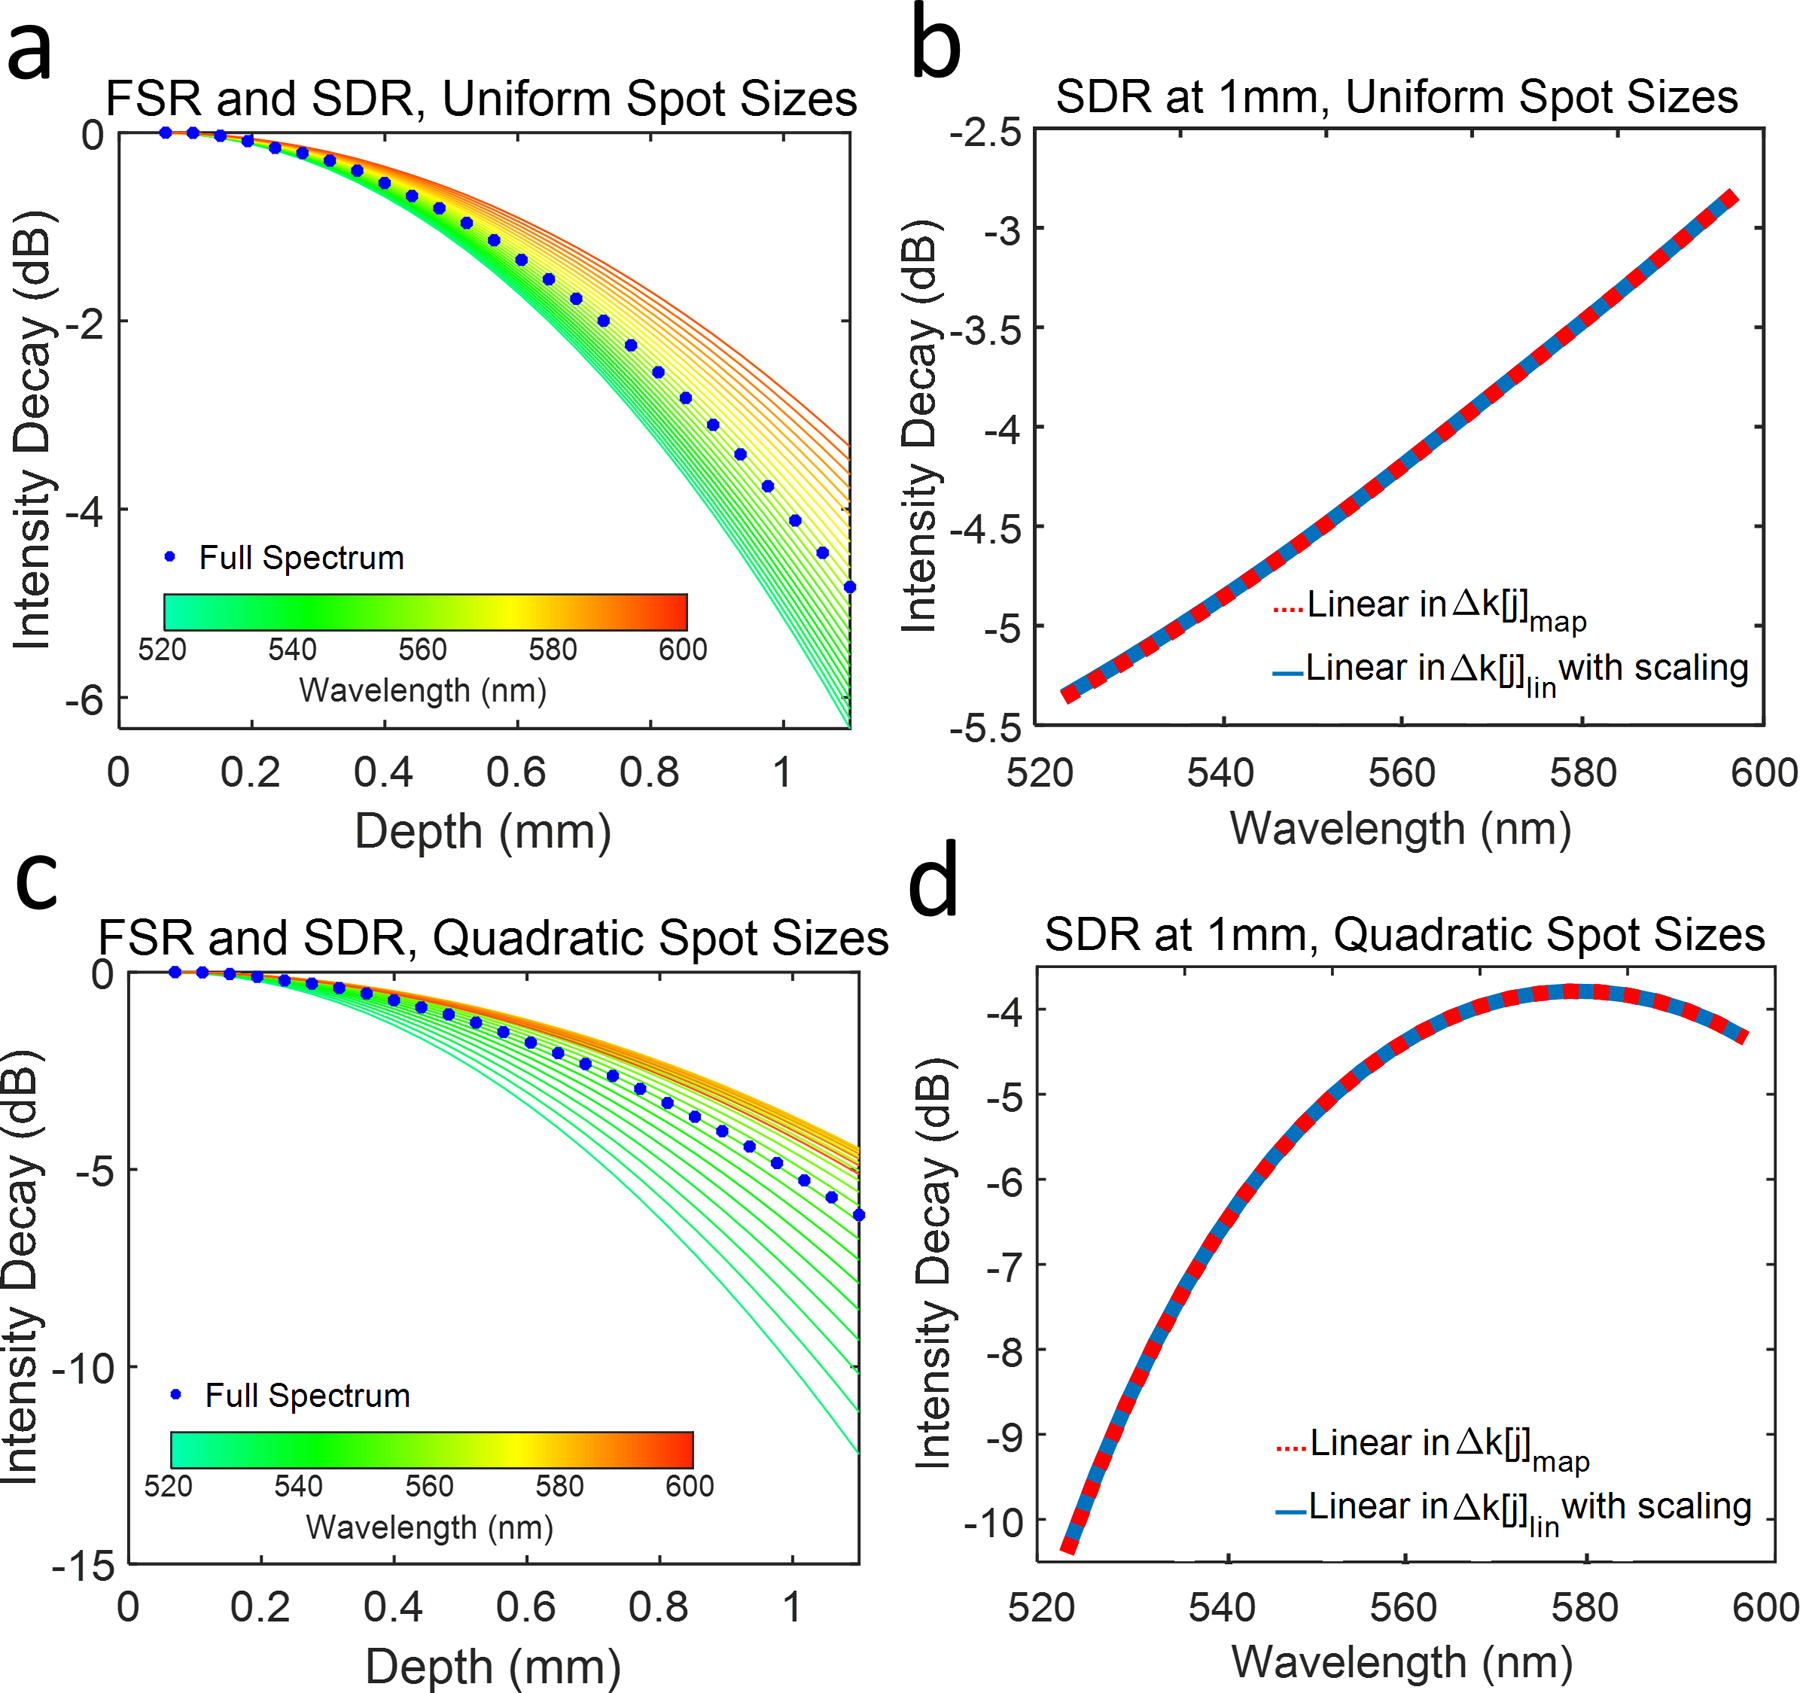
Fig. 2.

(a) Simulated FSR (blue dots) and SDR for uniform FWHM focal spot sizes incident on the pixel array. The color of each SDR curve reflects the central wavelength of the corresponding sub-band shown in the color bar. (b) SDR (red dashed line) and equivalent simulation (solid blue line) at 1-mm depth as a function of the central wavelength of each sub band (S(x) linear in Δk[j]map); (c) Simulated FSR (blue dots) and SDR for spot sizes varying quadratically with pixel index at an imaging depth up to 1.1 mm; (d) SDR (red dashed line) and equivalent simulation (solid blue line) at 1 mm imaging depth as a function of the central wavelength of each sub band (S(x) linear in Δk[j]lin).
