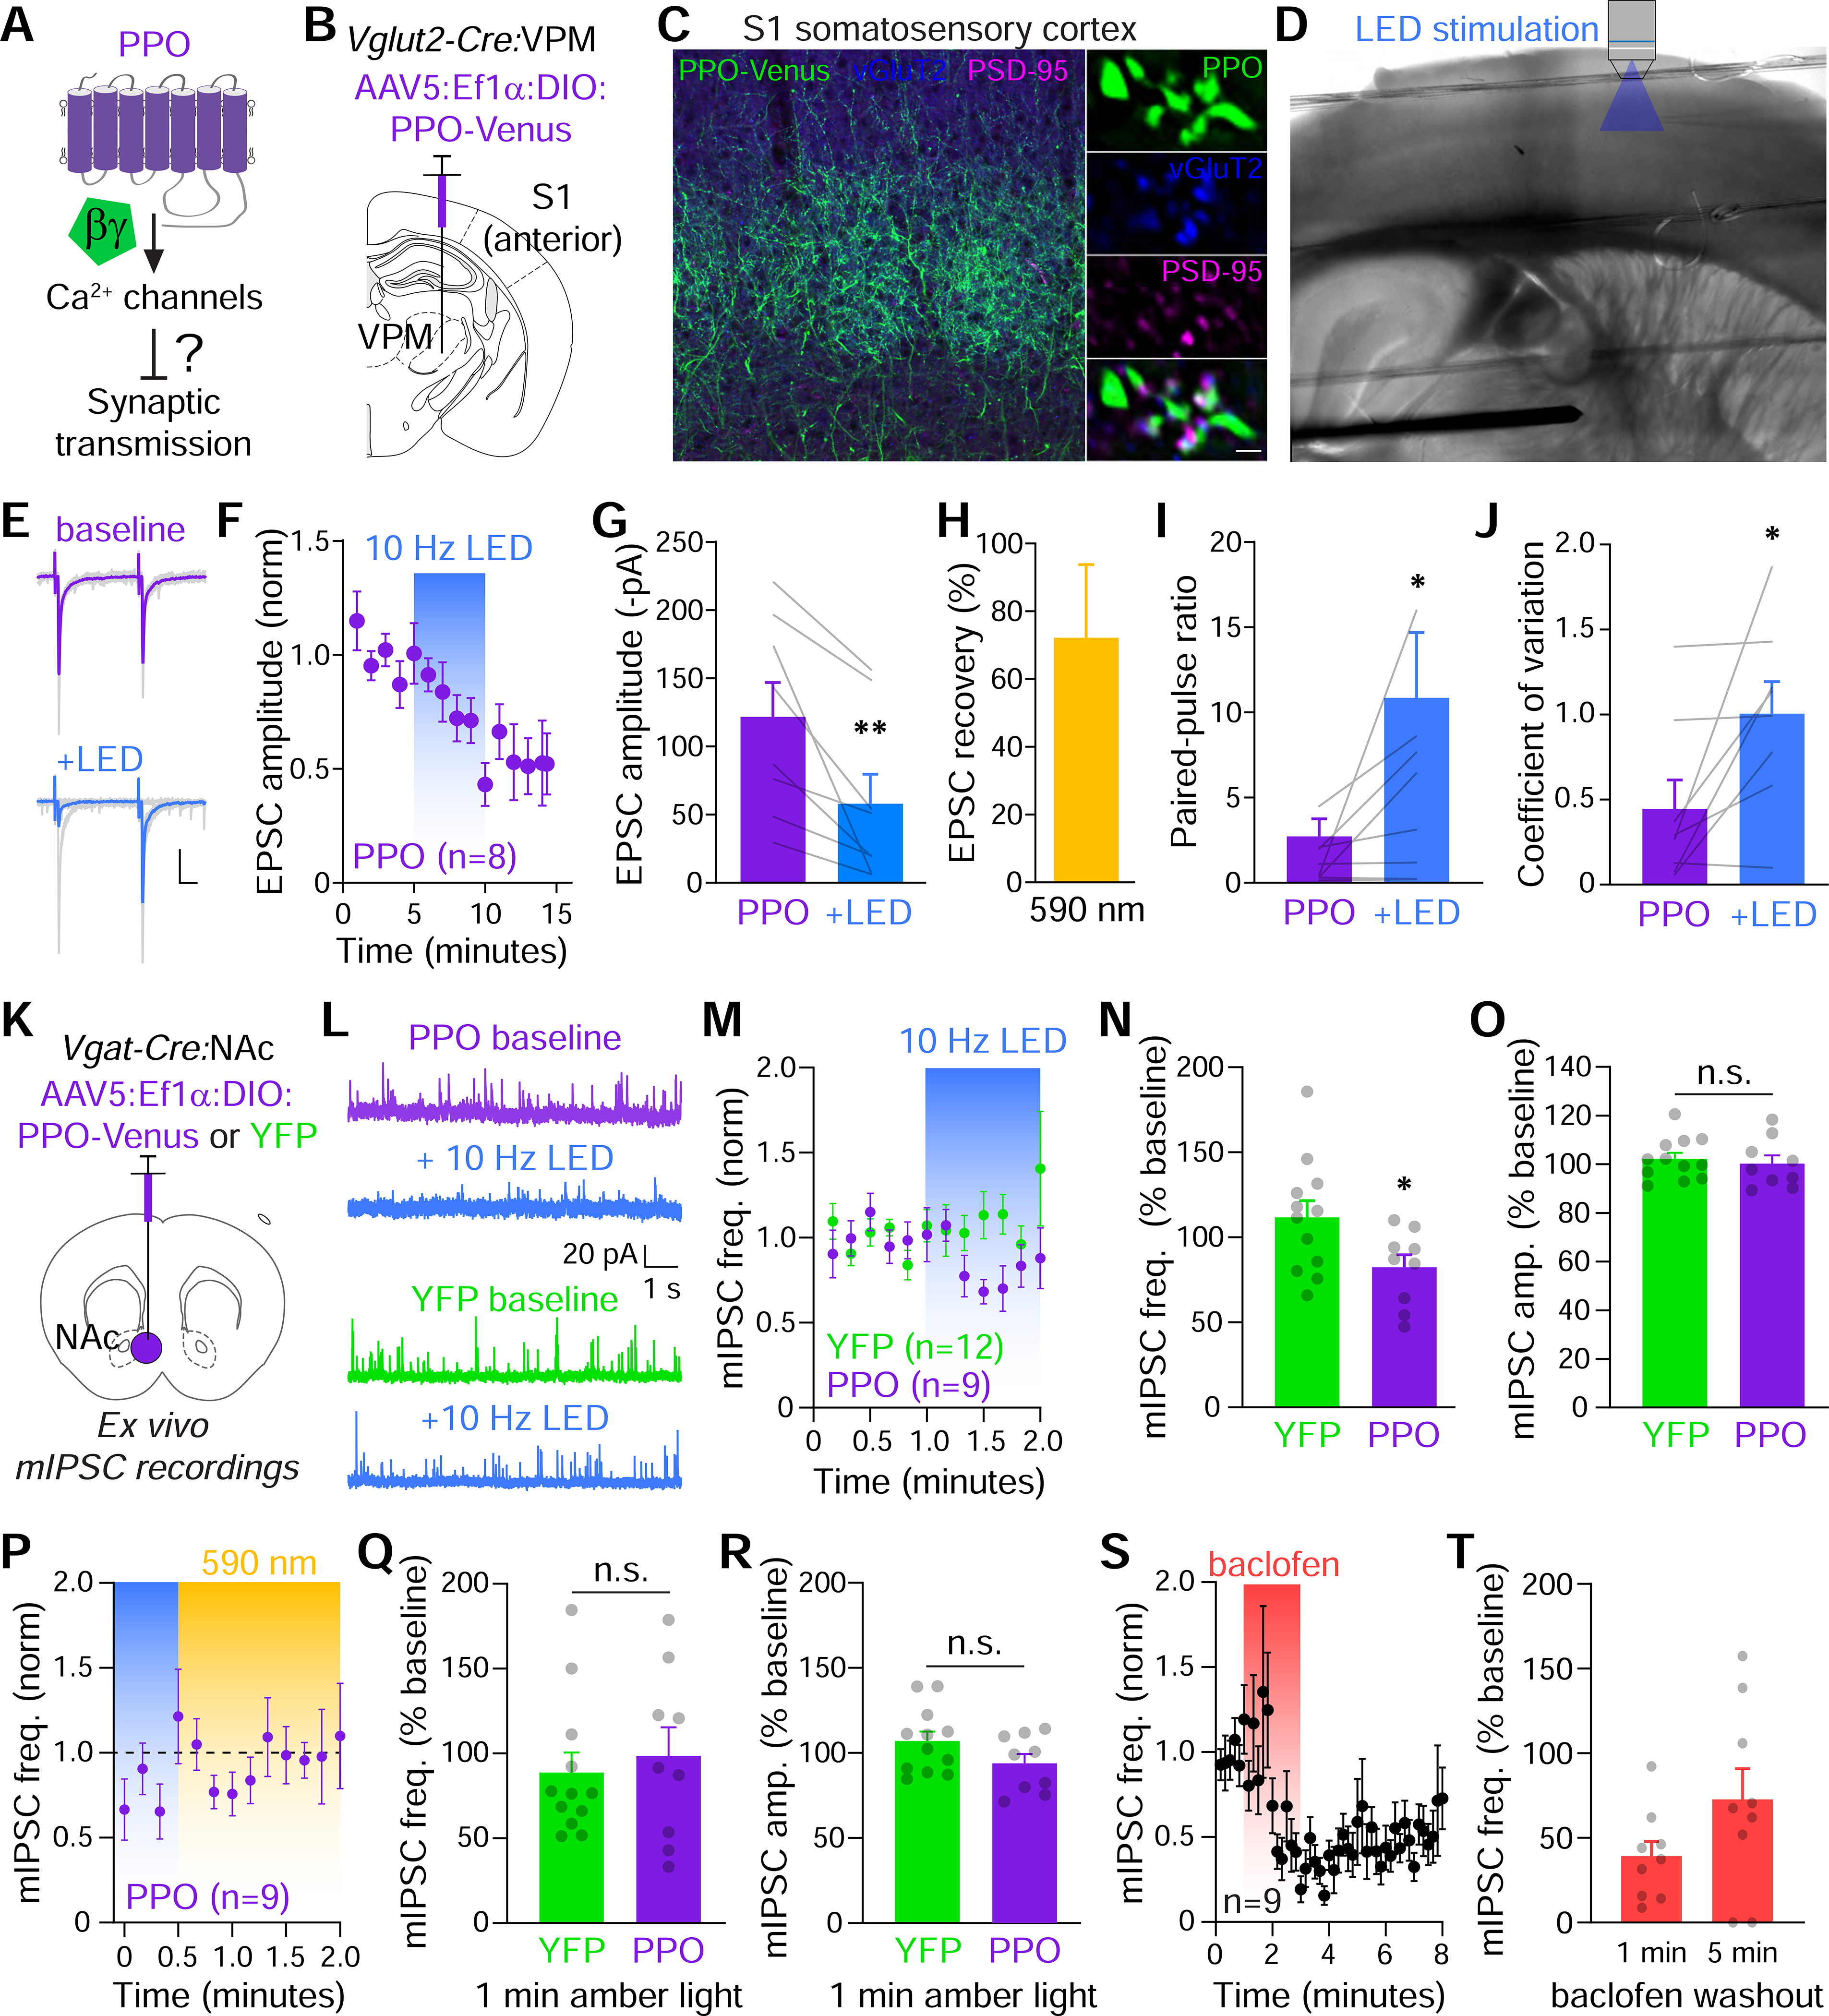
Figure 5. PPO inhibits presynaptic release at glutamatergic and GABAergic terminals.

(A) Experimental question asking if PPO can inhibit synaptic transmission at axon terminals.
(B) Cartoon depicting the injection site of Cre-dependent AAV5 (Ef1α:DIO:PPO-Venus) into the ventral posterior medial nucleus (VPM) of thalamus in Vglut2-Cre mice to target excitatory projections to primary somatosensory cortex (S1).
(C) Confocal micrograph of S1 from a Vglut2-Cre mouse expressing PPO-Venus in the VPM. PPO-Venus+ axons (green) densely innervated layer IV of the barrel cortex. Scale=100 μm. PPO (green) colocalized at presynaptic vGluT2+ terminals (blue) opposed to postsynaptic sites marked by PSD-95 (magenta). Scale=1 μm.
(D) IR-DIC images of an acute thalamocortical slice depicting the stimulating electrode in VPM and the patch pipette and objective for optical stimulation of terminals in S1.
(E) Representative EPSCs (gray) and averaged responses during baseline (purple) and 10 Hz LED stimulation (blue). Paired pulses were delivered at 50 ms intervals.
(F) Plot of normalized EPSC amplitudes which were inhibited by pulsed blue LED light (blue bar). Tau of inhibition was 2.6 minutes.
(G) Summary graph of EPSC amplitudes before and after 10 Hz photostimulation. n=8, paired t-test **p<0.01
(H) Summary graph of the reversal of inhibition after 30s of constant amber light, n=6 cells.
(I-J) Summary graph of EPSC paired pulse ratios (I), and coefficients of variation (J) before (purple) and after LED stimulation (blue). n=8, paired t-tests, *p<0.05
(K) Cartoon of the strategy to express Cre-dependent PPO-Venus or YFP in the NAc of Vgat-Cre mice. Acute slices were then used to record mIPSCs.
(L) Representative mIPSC traces recorded at 0 mV from non-fluorescent neurons in PPO or YFP-injected mice.
(M) Plot of normalized mISPC frequencies which were rapidly inhibited by the pulsed LED (blue bar) in PPO (n=9) but not YFP controls (n=12).
(N) Summary graph of the effect of 10 Hz LED on mIPSC frequencies (normalized to baseline) in YFP (n=12) and PPO (n=9) slices. t-test, *p<0.05
(O) Summary graph of normalized rmIPSC amplitudes in YFP (n=12) and PPO (n=9) slices. n.s. not significant
(P) Plot of normalized mIPSC frequency recovery in constant amber light (590 nm, 1 mW/mm2). n=9 slices.
(Q) Summary graph of mIPSC frequency recovery after 1 min. of amber light in YFP (n=12) and PPO (n=9) slices. n.s. not significant
(R) Summary graph of mIPSC amplitudes after 1 min. of amber light in YFP (n=12) and PPO (n=9) slices. n.s. not significant
(S) Plot of normalized mIPSC frequencies in response to 50 μM baclofen for 2 min. (coral bar) in slices from YFP-injected mice (n=9).
(T) Summary graph of mIPSC frequency recovery 1 and 5 min. after washout of baclofen, n=9 slices.
