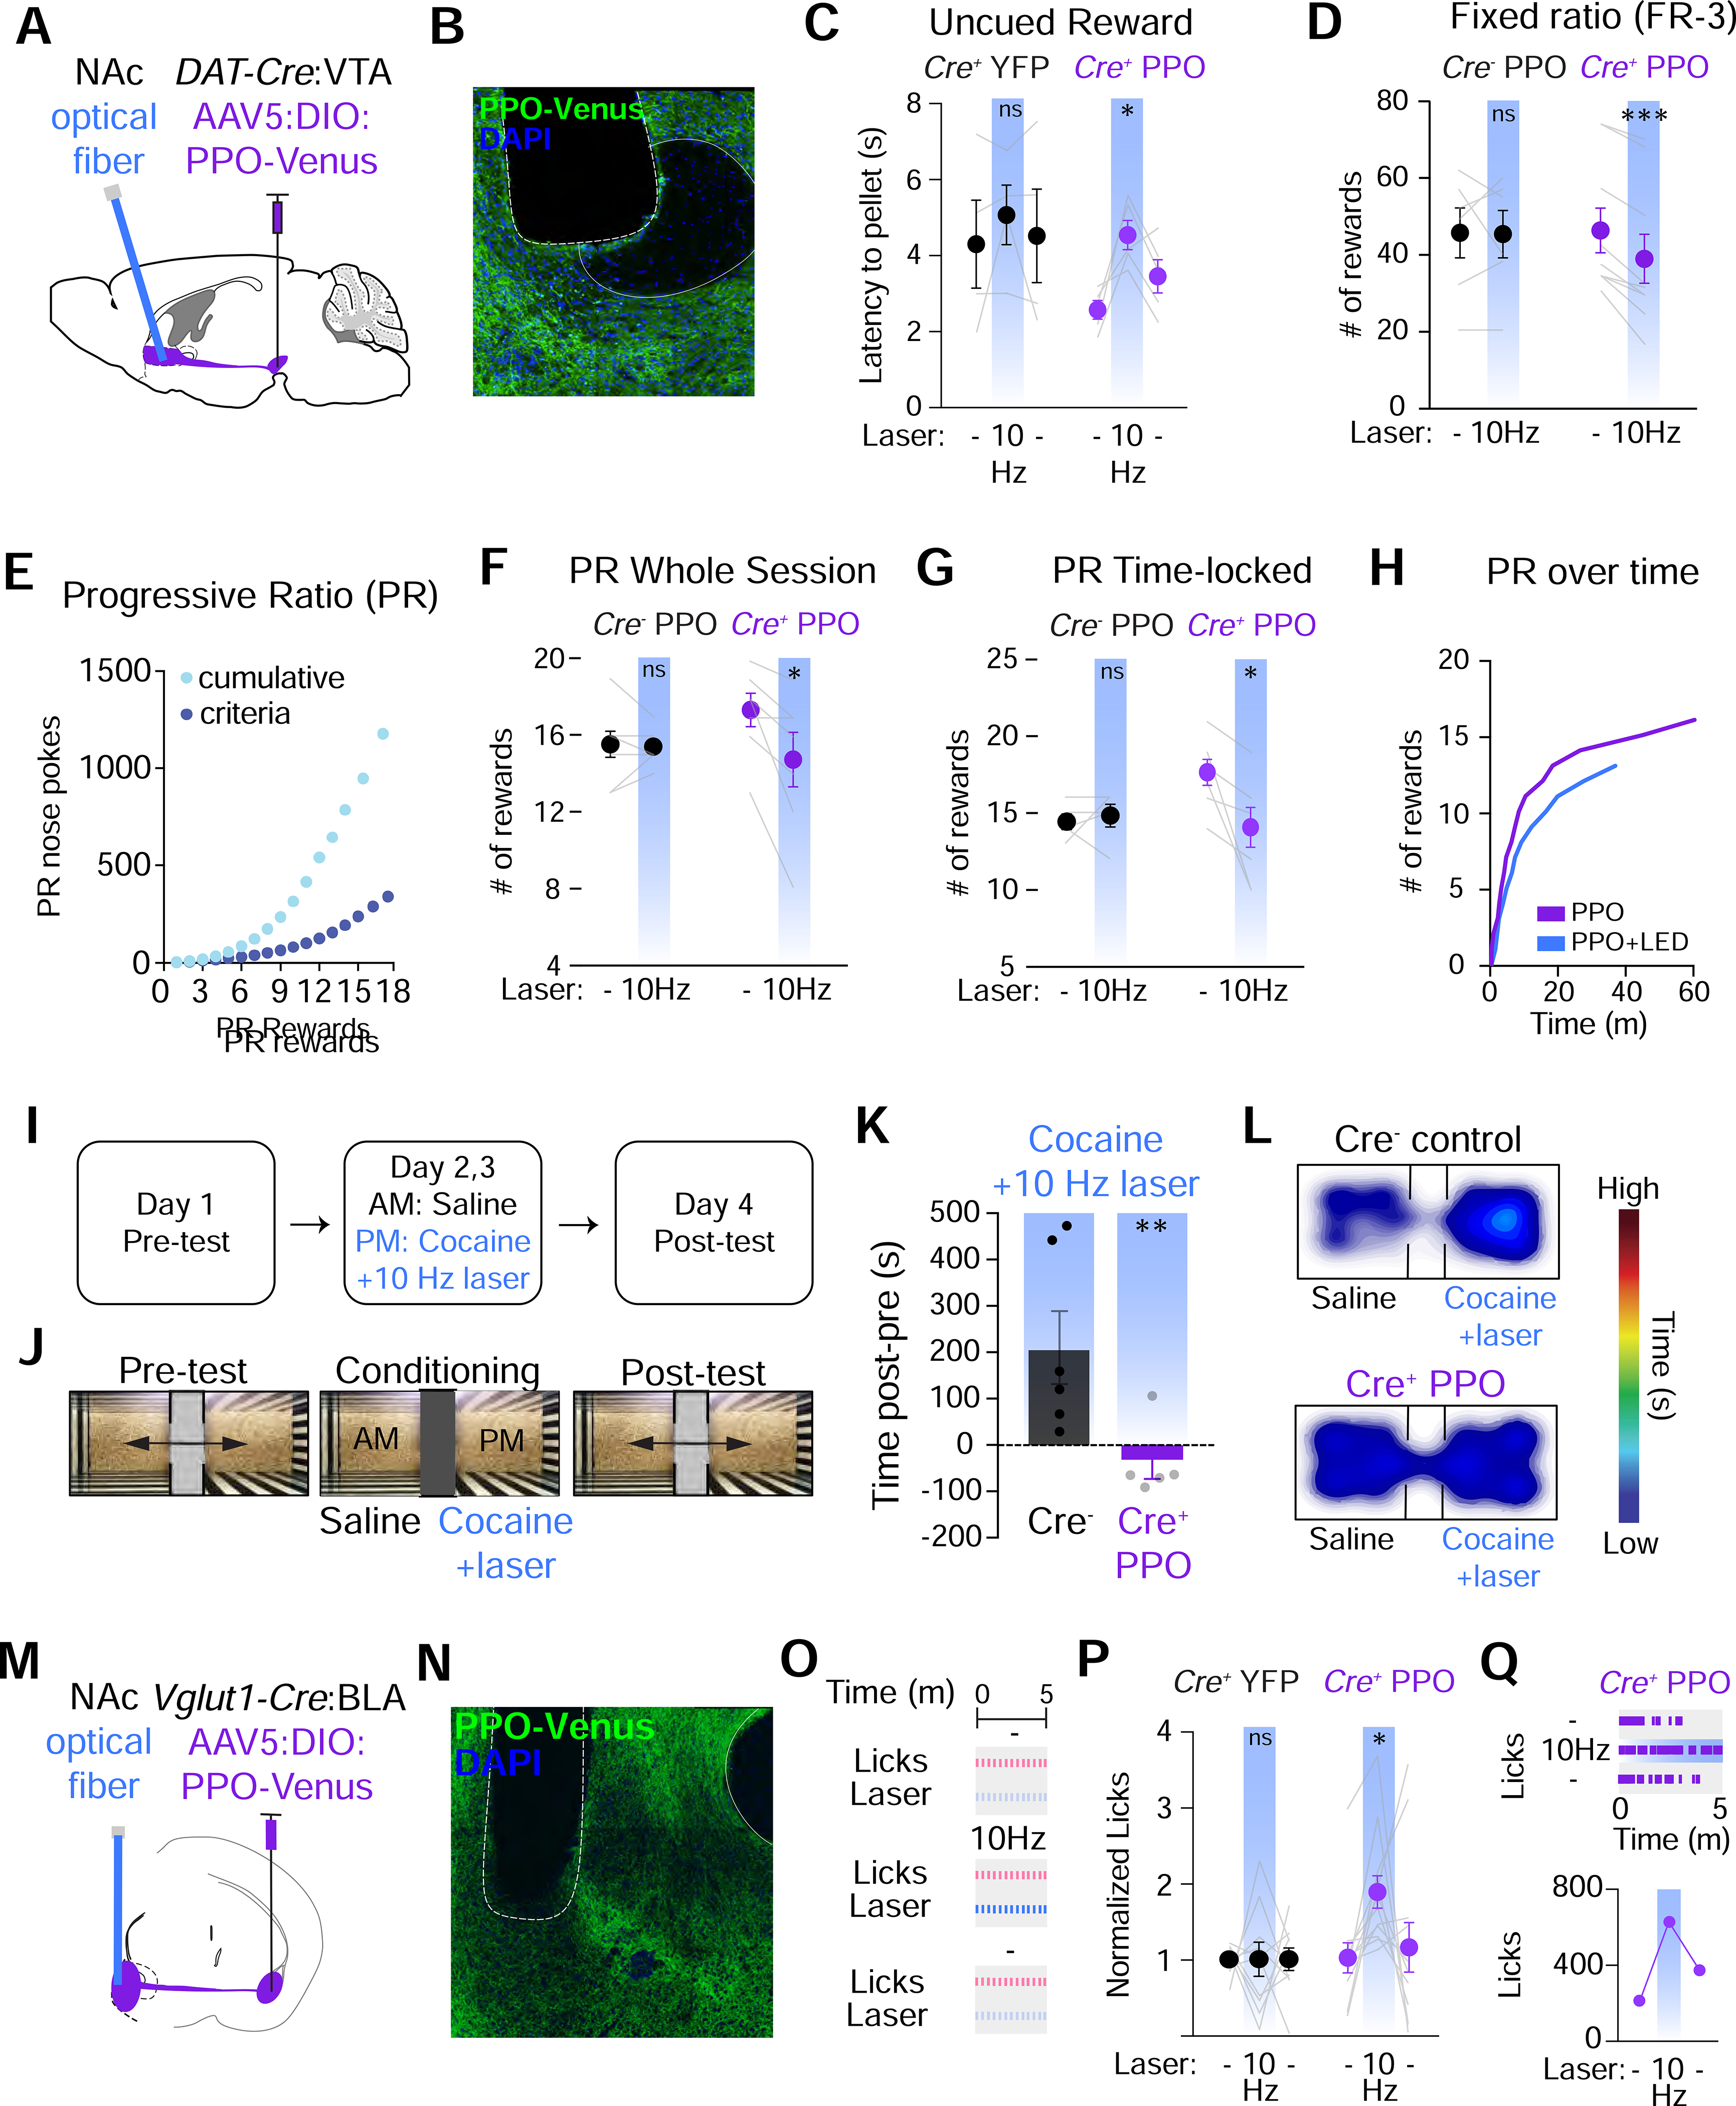
Figure 7. PPO inhibits dopamine neuron terminals to suppress reward seeking behaviors.

(A) Cartoon of the strategy to inhibit DA neuron projections to the NAc. Cre-dependent AAVs were injected into the VTA of DAT-Cre mice and optical fibers were placed above their terminals in the NAc core.
(B) Confocal micrograph of PPO-Venus in DA neuron terminals of the NAc. The placement of the optical fiber is shown. Scale=100 μm
(C) Summary graphs of uncued reward delivery task. Terminal illumination (blue bars) increased the latency to retrieve pellets in PPO mice (right, n=5), but not YFP controls (left, n=4). Mixed-effects 1-way ANOVA, *p<0.05. Mult. comparisons: (−) vs. 10 Hz, *p<0.05
(D) Summary graphs of FR-3 testing. Terminal illumination (blue bars) decreased the # of rewards that mice received in Cre+ mice (right, n=9), but not Cre− controls (left, n=6). Paired t-test ***p<0.001
(E) Example graph of the escalating nose pokes to receive a reward in progressive ratio (PR) testing.
(F) Summary graph of PR testing. Terminal illumination (blue bars) decreased the # of rewards received in Cre+ mice (right, n=7), but not Cre− mice (left, n=8). Paired t-test *p<0.05.
(G) Summary graph of nose poke-triggered, time-locked PR testing. Terminal illumination (blue bars) decreased the # of rewards received in Cre+ mice (right, n=5), but not Cre−controls (left, n=6). Paired t-test *p<0.05.
(H) Representative trace of rewards earned in a PR session over time +/− blue light stimulation.
(I-J) Experimental timeline and set-up for testing cocaine preference behaviors. During pre-testing mice could freely explore the 2 chambers. During pairing, mice were given saline in 1 chamber and cocaine (10 mg/kg) + 10 Hz blue light in the other. After 2 days of pairing, preference for either chamber was determined.
(K) Summary graph of difference in time spent in the cocaine-paired chamber. Cre− control mice (n=6) exhibit strong preference for the cocaine-paired chamber which was completely blocked by photoinhibition in PPO-expressing mice (n=5). Both groups received optical stimulation during cocaine-pairing. t-test **p<0.01
(L) Heat maps of relative time spent in each chamber.
(M) Cartoon depicting glutamatergic neuron projections to the NAc. Cre-dependent AAVs were injected into the BLA of Vglut1-Cre mice and optical fibers were placed above terminals in the NAc shell.
(N) Confocal micrograph of PPO-Venus expression in BLA neuron terminals of the NAc. The placement of the optical fiber is shown. Scale=100 μm
(O) Schematic depicting sucrose licking task and experimental design.
(P) Normalized sipper licks. n=12 Cre+ and n=10 Cre− mice. For Cre+: Mixed-effects 1-way ANOVA, *p<0.05. Mult. comparisons: (−) vs. 10Hz, *p<0.05 and 10Hz vs. (−), *p<0.05. All other comparisons ns
(Q) Top: Representative lick raster plots for (−) vs. 10Hz vs. (−) conditions. Bottom: Raw licks for a single animal
